
The State of STR Direct Booking Readiness 2026
An automated audit of 1,939 short-term rental operator websites, randomly sampled from a database of approximately 15,000 operator domains
hostAI Research · July 2026 · Version 1.0
Executive summary
Between July 13 and 14, 2026, we audited 1,939 professionally managed short-term rental (STR) operator websites, randomly sampled from a database of approximately 15,000 operator domains, against a defined standard of direct booking readiness. Six findings summarize the results; findings 3, 4, and 5, and the counts in finding 2, are direct observations independent of the composite score.
-
Of the 1,939 audited sites, 11 (0.6%) met hostAI Scan's direct-ready threshold (composite score ≥67); none reached the Strong band (≥75). The result holds under equal-source weighting (0.6%) and under restriction to medium/high-confidence audits (1.2%, 10 of 807).
-
26.0% of sites (504) route guests to a third-party domain to complete checkout. Among sites with a classified booking path, those with on-site booking (n=721) score 27.8 points higher on the conversion category than those with off-site checkout (67.9 vs 40.1; partly definitional, see §3.2).
-
An automated booking agent attempting a standardized booking task reached a checkout page on 19.5% of sites (378 of 1,939); it located a bookable property on 47.6%.
-
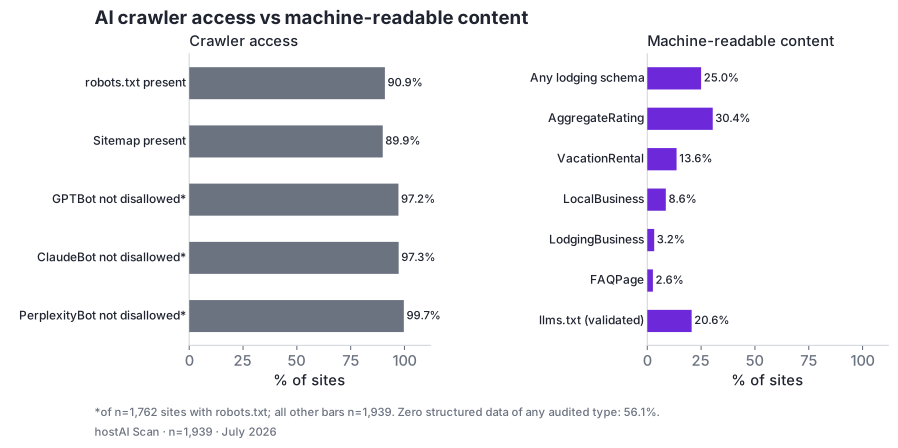
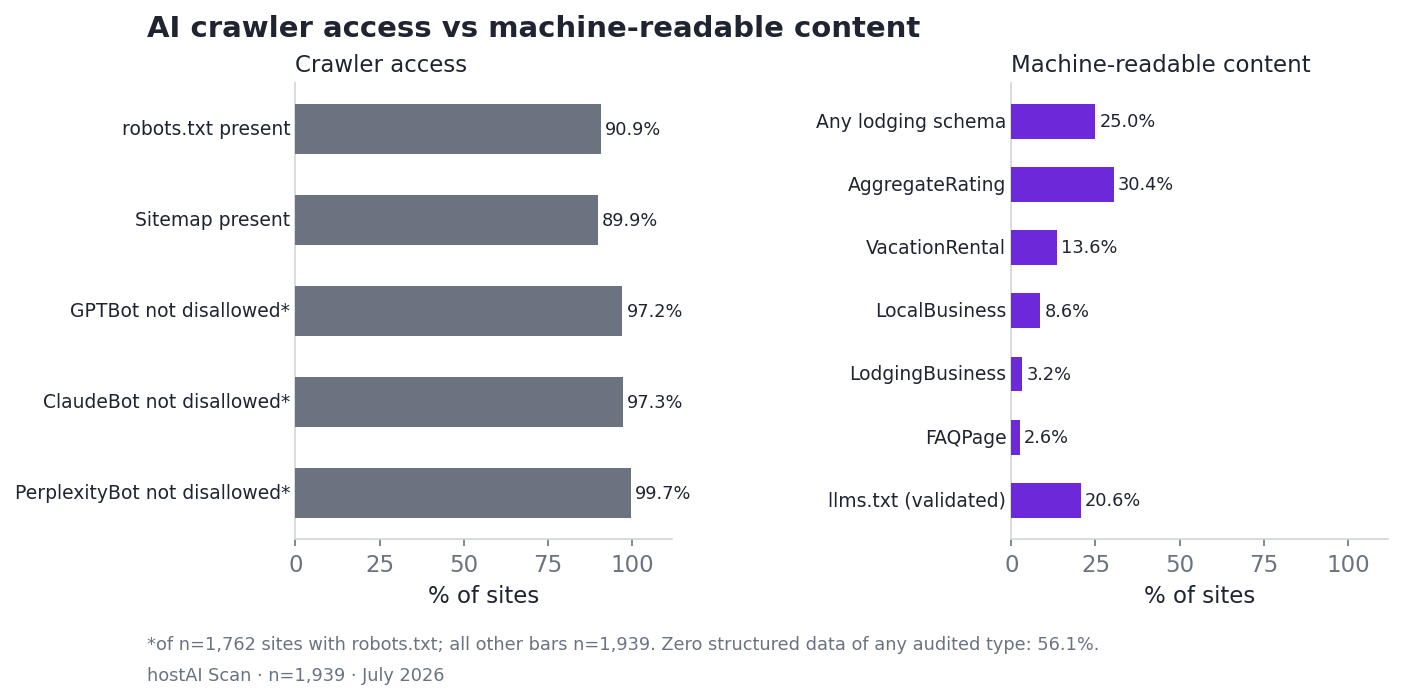
Of 1,762 sites publishing robots.txt, one (0.1%) disallows all major AI crawlers; individual crawlers are not disallowed on 97.2% (GPTBot) to 99.7% (PerplexityBot) of those sites. 56.1% of all 1,939 sites expose no structured data of any audited type; 2.6% publish FAQPage schema.
-
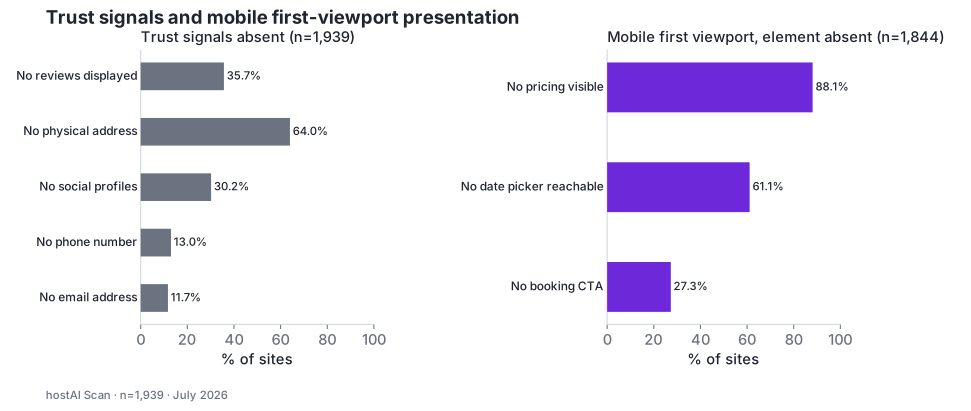
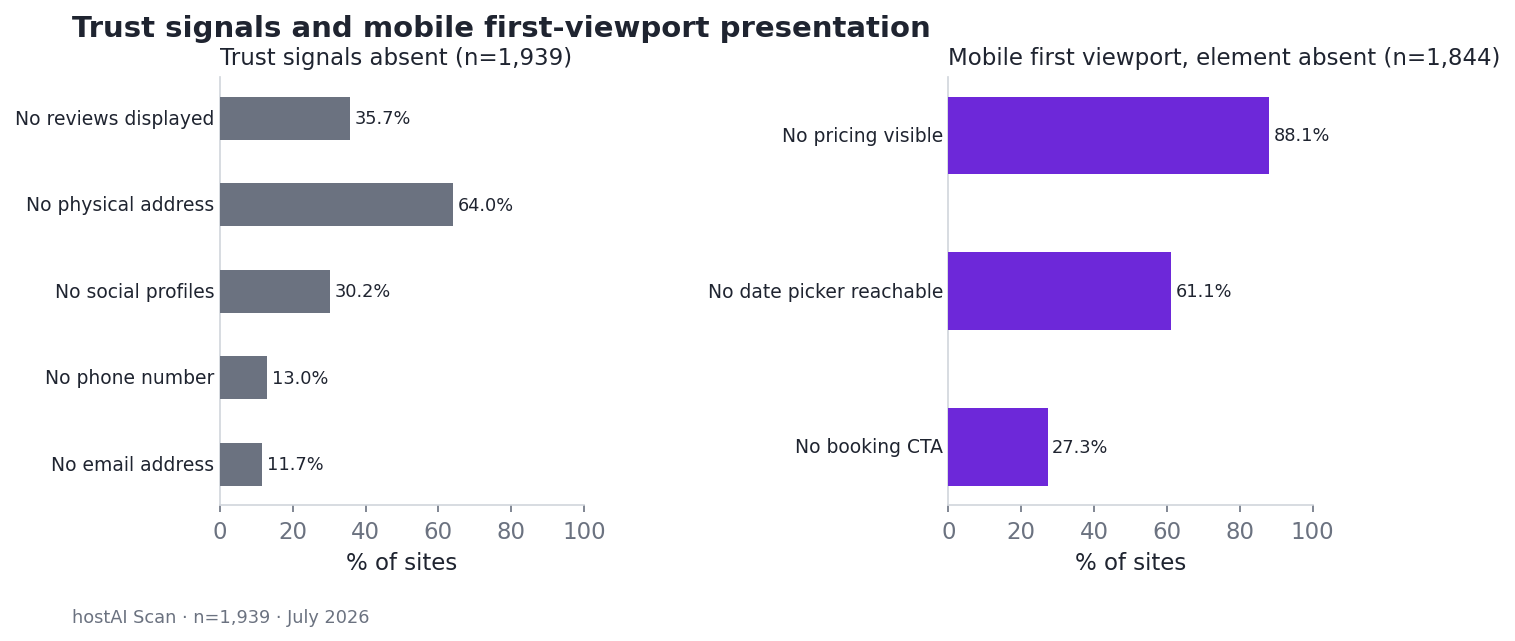
In the sampled pages (n=1,939), 35.7% of sites display no guest reviews and 64.0% no physical address. On the mobile first viewport (n=1,844, obstruction-excluded), 27.3% present no booking CTA and 88.1% display no pricing.
-
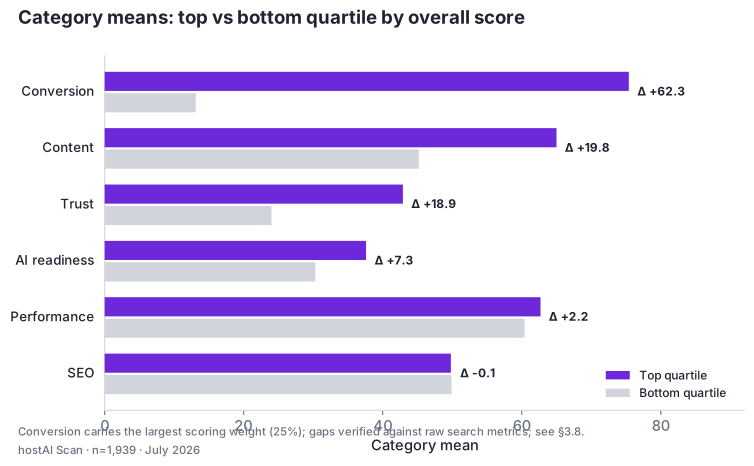
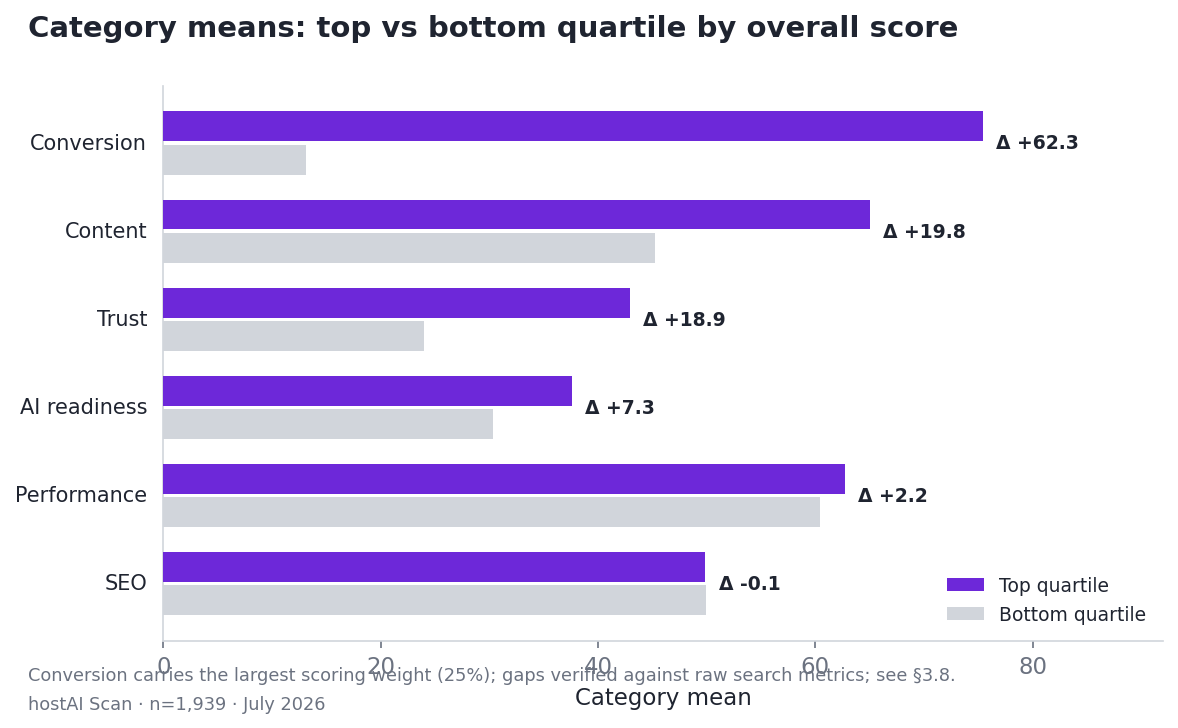
Top-quartile sites (by overall score) differ from bottom-quartile sites by +62.3 points on the conversion category; differences on SEO (−0.1) and performance (+2.2) are negligible.
What this study does not show. The agent's completion rates measure machine-navigability, not human booking success. Scores are hostAI Scan's benchmark, not measurements of revenue or realized conversion. Retention and price competitiveness are outside external observation.
1. Background
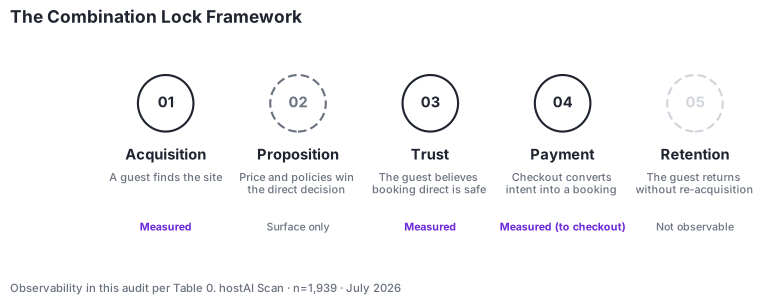
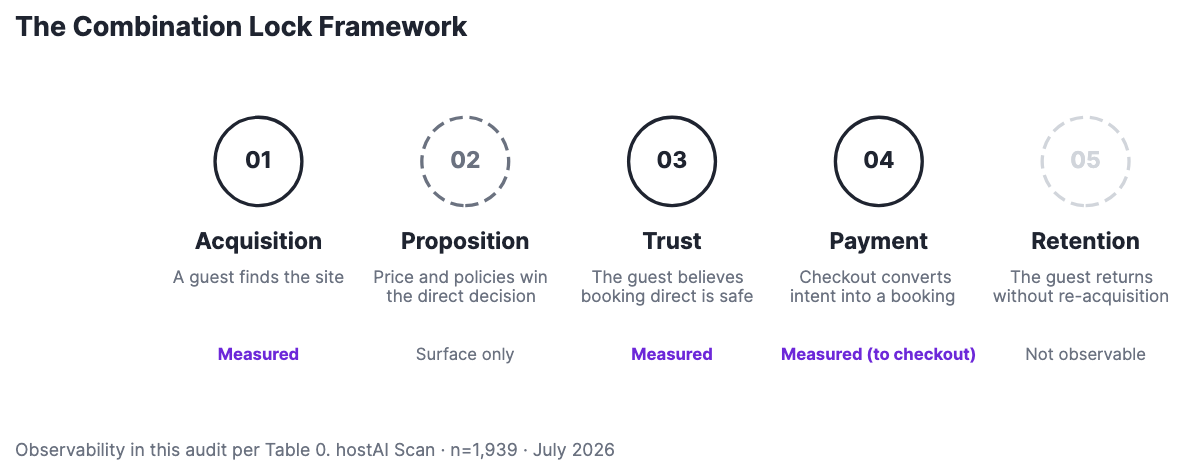
The Combination Lock Framework, developed by hostAI, describes a direct booking channel as requiring five conditions to hold simultaneously: acquisition (a guest finds the site), proposition (price and policies win the direct decision), trust (the guest believes booking direct is safe), payment (checkout converts intent into a booking), and retention (the guest returns without being re-acquired). In this framework, direct booking underperforms not because operators address none of these conditions but because they address some and not others.
What the framework supplies here is a measurable definition of readiness: a website is ready for direct booking to the extent that the externally observable conditions hold on that website. This report is an attempt to establish, at industry scale, how ready STR direct booking websites currently are, using only signals observable from outside the operator's business. To that end, we audited 1,939 STR direct booking websites on July 13–14, 2026, using a standardized automated instrument, and report the results in full alongside the methodology, its limitations, and the data behind every figure.
Table 0 states which conditions an external audit can and cannot observe, and where each measured signal is reported.
Table 0. Framework conditions and audit coverage
| Condition | External observability | Audit coverage |
|---|---|---|
| Acquisition | Observable | Search visibility (§3.7); machine-readable discovery for AI systems (§3.4); content signals |
| Proposition | Surface only | Price presentation at entry (§3.6); competitiveness of rates and policies is not observable |
| Trust | Observable | Review display, contact and identity signals (§3.5) |
| Payment | Observable (to checkout) | Booking architecture, the on-site vs off-site checkout-path classification (§3.2); booking-path completion (§3.3); conversion category |
| Retention | Not observable | Outside scope; leaves no external trace |
Site performance (§3.7) is measured as cross-cutting infrastructure affecting several conditions rather than as a condition of its own; the content category likewise serves both acquisition and proposition presentation. Booking architecture is listed under payment because it measures the structure of the checkout path; the domain-continuity aspect of off-site checkout also bears on the trust condition. The mapping records what each signal measures, not the mechanism by which it matters. The instrument's six scoring categories (§2.2) are its operationalization of the observable conditions, not a one-to-one decomposition of the framework.
2. Methodology
2.1 Population
We attempted audits on 2,206 domains on July 13–14, 2026. 2,013 completed; one completed audit was excluded in post-audit review (§2.5). Seventy-three sites operated on our own platform were audited but excluded, by source tag, from all sample statistics, leaving an audited sample of n=1,939, which is the basis of every finding in Section 3 unless a different n is stated.
The sample was drawn at random from hostAI's database of approximately 15,000 STR operator domains, assembled from operator lists spanning five property management system (PMS) ecosystems plus an independently assembled benchmark list (one ecosystem contributes two source lists; seven lists in total). Selection applied no filter on website quality or any other site characteristic. The result is a random sample of that database; the database itself is not a census of the industry. Composition: United States domains constitute 78% of the population (1,507 of 1,939); Germany (93), the United Kingdom (29), and Canada (21) are the next largest groups; country could not be determined for 224 sites. Where portfolio size could be estimated (n=823 of 1,939), the identifiable subset is composed predominantly of small operators: single-unit operators account for 279 sites and operators with more than 20 units for 66. The largest single source list contributes 39% of the sample; a robustness check for source composition is reported in §2.4. A detectable booking engine was not an inclusion requirement; its absence on 35.5% of sites is itself reported as a finding (§3.2).
2.2 Instrument
All audits were produced by the hostAI Scan system: the same scoring instrument running in the production tool, not one constructed for this report; the instrument, its weights, and its bands were in production before this audit was conducted. Each audit measures six categories: conversion, trust, content, AI readiness, SEO, and performance, combined into an overall score from 0 to 100. The scoring rubric (category weights, band definitions, and summary criteria) is published in Appendix 1. The audit is publicly runnable on any domain at scan.gethostai.com.
2.3 Operational definitions
On-domain bookability (baseline condition). A guest can locate a property, select dates, view a price, and complete a booking without leaving the site's domain (the audit verifies this capability to the checkout stage; no payment is executed). This is the baseline transactional condition of a direct channel. It is not by itself sufficient for readiness: a site can satisfy it while presenting weak trust signals, poor entry-point usability, or no acquisition surface. The composite standard below weights it heavily without strictly requiring it.
Direct-ready (composite standard). A site is direct-ready when the externally observable framework conditions (§1, Table 0) collectively meet a sufficient standard. The overall score (§2.2) operationalizes the composite as a weighted standard, not a set of individual requirements: strength on some conditions can partially offset weakness on others. The conversion category, which scores the booking path, carries the largest single weight (25%); consequently most, though not all, threshold-clearing sites complete checkout on-domain; a small number clear the threshold with off-site checkout. The threshold and bands below are the instrument's published calibration of sufficiency. Findings on the baseline condition appear in §3.2–3.3; findings on the composite standard in §3.1.
Score bands. Below 60: Needs Work. 60–66: Fair. 67–74: Good, the "direct-ready" threshold used throughout this report. 75 and above: Strong.
The automated booking agent. Each site was explored by an automated booking agent attempting a standardized task: locate a bookable property, select dates, and proceed to checkout; it does not execute payment. The agent is an LLM-driven browser agent executing the same natural-language task specification on every site. The agent classified 47.6% of sites (922 of 1,939) as navigable enough to operate meaningfully. This measure is nearly coextensive with the property-location outcome in §3.3: all 922 navigable sites also located a property, and one additional site located a property without meeting the navigability classification (923 total). Agent results measure machine-navigability, not human impossibility: a determined human completes more journeys than the agent does. The implications of this distinction are discussed in §4 and §5.
Booking architecture classes. Each site's booking path was classified from static engine evidence combined with the agent's observed checkout destination, into seven classes: embedded (booking completed within the site's own pages), custom/native on-site (a bespoke on-site booking form), none detected (no operable booking path found), PMS-hosted checkout (guest routed to a third-party hosted payment page), behavioral external redirect (guest routed to an external domain observed during exploration), subdomain hop (booking on a separate subdomain of the operator's own domain), and dead destination (booking link resolves to a non-functioning target).
Two groupings are used for comparison. On-site combines embedded and custom/native (n=721). Off-site combines PMS-hosted checkout, behavioral external redirect, and dead destination (n=504), the classes in which the booking path exits the operator's domain. This classification measures the domain-continuity of the guest journey; it does not bear on the commercial directness of the booking. A reservation completed through a PMS-hosted checkout remains a direct booking to the operator; what changes is the domain on which the guest transacts. Subdomain hop (n=25) is not counted as off-site because the destination remains the operator's own domain. Sites with no detected booking path (n=689) belong to neither group and are excluded from on-site/off-site comparisons; they are reported as their own class throughout.
2.4 Robustness
Two sensitivity checks were applied to the headline finding, both computed on the audited sample only.
First, source composition. Because the largest source list contributes 39% of the population, we recomputed the headline weighting all seven source lists equally (mean of per-source means). The mean overall score moves from 47.2 to 48.1 and the direct-ready share is unchanged at 0.6%.
Second, audit confidence. Restricting to audits whose conversion evidence was rated medium or high confidence, a rating reflecting how many independent evidence types (vision, behavioral, static) agreed, yields n=807, mean 51.7, direct-ready 1.2% (10 sites), and zero Strong sites. Because clearer sites may earn both higher scores and higher confidence, this is a robustness check rather than an independent measurement.
Both checks preserve the order of magnitude of the finding: under each cut, fewer than 2% of audited sites meet the direct-ready threshold and none reaches Strong.
2.5 Refusals, exclusions, and coverage
Of 2,206 attempted audits, 193 did not complete: 95 domains did not meet the population definition and were excluded, 86 (3.9% of attempts) could not be read by automated tools, and 12 did not resolve. One additional domain that completed an audit was identified in post-audit review as not an STR direct booking business and was excluded from the audited sample.
Within the audited sample, subsystem coverage varies and is stated with each finding: PageSpeed data is absent for 212 sites (10.9%); among the 1,727 sites with PageSpeed data, a field LCP measurement is available for all 1,727 and a Lighthouse performance score for 1,720. SEMrush search estimates cover n=1,938, and mobile viewport analysis covers n=1,844 after excluding 75 obstructed captures and 20 sites without a completed mobile analysis. Statistics computed on small subsets carry their n at the point of use.
2.6 Anonymization
Booking infrastructure is reported by architecture class. No PMS vendor, booking engine vendor, or website platform is named in this report, in its charts, or in its published data.
3. Findings
3.1 Overall readiness distribution
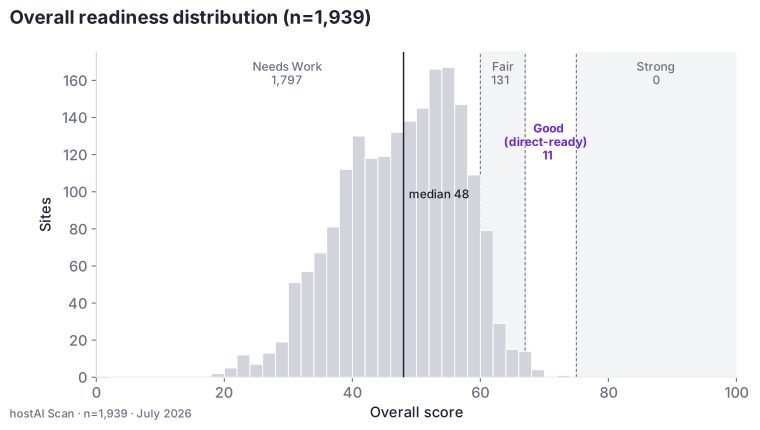
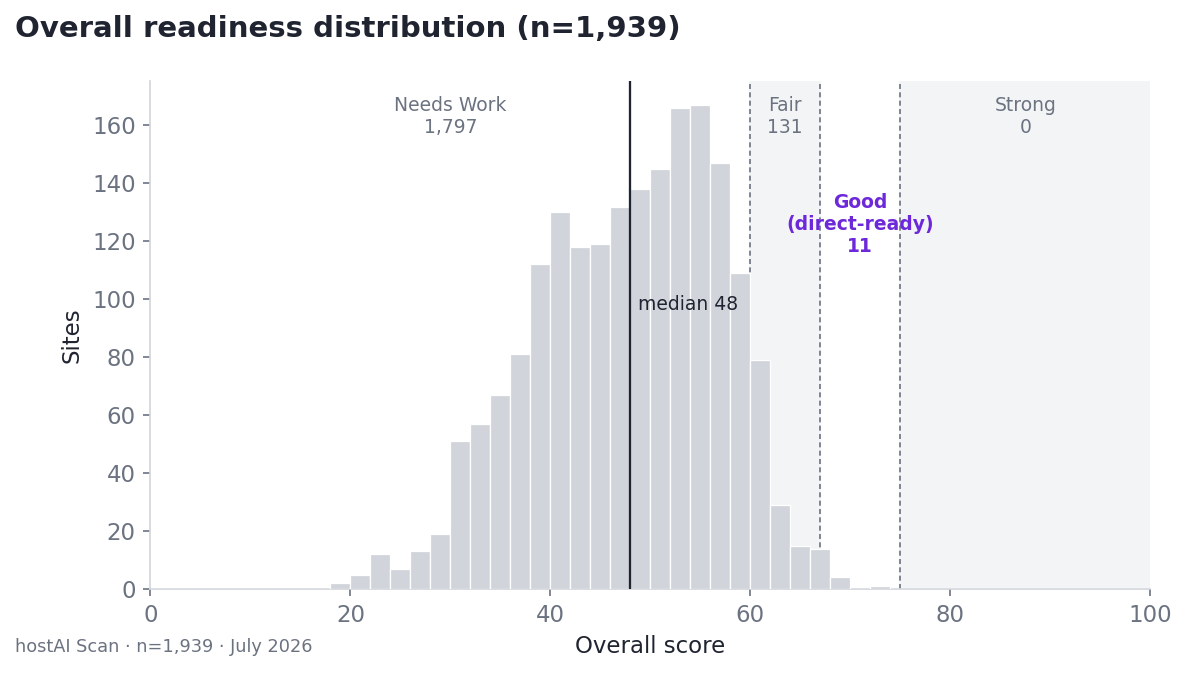
Across the audited sample (n=1,939), the mean overall score is 47.2 and the median is 48. 1,797 sites (92.7%) fall in the Needs Work band, 131 (6.8%) in Fair, and 11 (0.6%) in Good, the direct-ready threshold. No site reaches the Strong band. Five sites score 68 or above, with a maximum of 72. The conclusion is not sensitive to the cutoff: under any threshold from 60 to 75, the qualifying share ranges from 7.3% to zero (Appendix 2, A2.4).
Category means order as follows: performance 61.3, content 56.9, SEO 49.3, conversion 45.5, AI readiness 34.3, trust 34.2. The two weakest categories, AI readiness and trust, are examined in §3.4 and §3.5; the significance of the ordering is taken up in §5.
3.2 Booking architecture and conversion outcomes
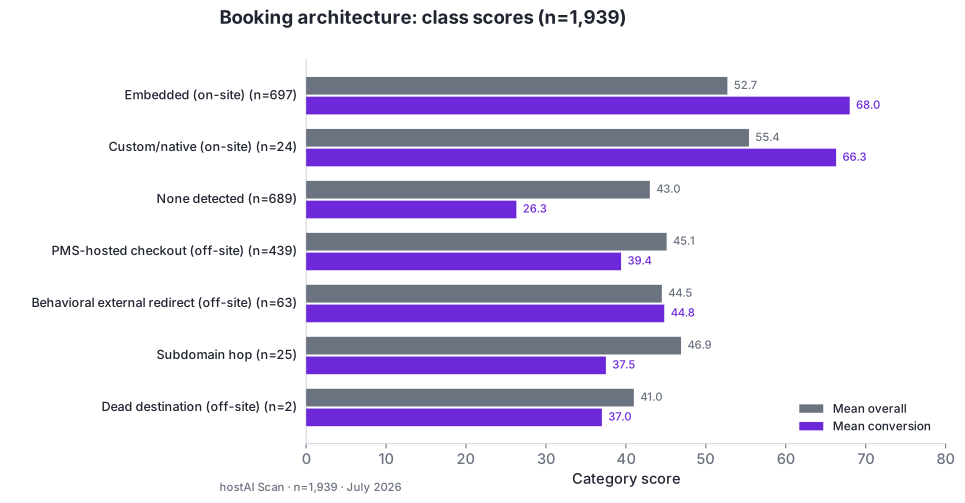
Table 1 classifies the audited sample by booking architecture (classes defined in §2.3).
Table 1. Booking architecture distribution and category scores (n=1,939)
| Architecture class | n | Share | Mean overall | Mean conversion |
|---|---|---|---|---|
| Embedded (on-site) | 697 | 35.9% | 52.7 | 68.0 |
| Custom/native (on-site) | 24 | 1.2% | 55.4 | 66.3 |
| None detected | 689 | 35.5% | 43.0 | 26.3 |
| PMS-hosted checkout (off-site) | 439 | 22.6% | 45.1 | 39.4 |
| Behavioral external redirect (off-site) | 63 | 3.2% | 44.5 | 44.8 |
| Subdomain hop | 25 | 1.3% | 46.9 | 37.5 |
| Dead destination (off-site) | 2 | 0.1% | 41.0 | 37.0 |
| Total | 1,939 |
Shares may not sum to 100.0% due to rounding.
In aggregate, 504 sites (26.0%) route guests to a third-party domain to complete checkout (the three off-site classes). Comparing the two grouped classes defined in §2.3: on-site sites (n=721) average 67.9 on the conversion category and 52.8 overall; off-site sites (n=504) average 40.1 on conversion and 45.0 overall; the gaps are 27.8 and 7.8 points respectively. Sites with no detected booking path (n=689) average 26.3 on conversion, the lowest of any class, and are excluded from the grouped comparison.
Architecture composition also differs sharply across the score distribution. In the top quartile by overall score, 63% of sites are embedded; in the bottom quartile, 9% are embedded and 59% have no detected booking path.
Two measurement notes apply. First, the conversion score's definition of booking capability includes a fixed deduction where checkout completes off the operator's domain (Appendix 1); the grouped gap therefore partly restates the instrument's definition rather than independently observed behavior, and §5 discusses the interpretive consequence. Second, the none-detected class contains both sites that genuinely offer no online booking and sites whose booking path our classification failed to detect. The two cannot be fully separated by automated means, which is why the class is reported separately rather than folded into either grouping. Following manual review of all threshold-clearing sites, no direct-ready site remains in this class.
3.3 Booking-path completion
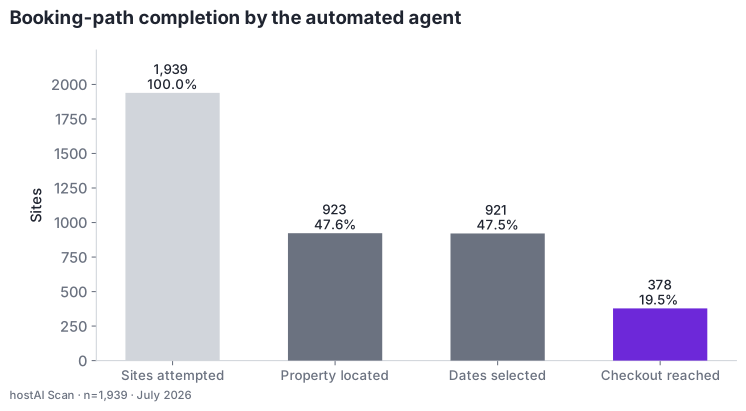
The automated booking agent attempted its standardized task on all 1,939 sites. It located a bookable property on 923 sites (47.6%), selected dates on 921 (47.5%), and reached a checkout on 378 (19.5%).
Where full interaction paths were captured (n=90), the median number of clicks from landing page to checkout was 4, and 15.6% of those journeys crossed to a different domain mid-path. A separate static heuristic estimating the shortest clickable path to a booking action across all sites yields a median of 8; this is a structural measure of page depth, distinct from the agent's observed click counts, and the two are not comparable. Completion rates are also not comparable across architecture classes: two classes are identified partly from the agent's observed checkout destination, and redirect-style paths are mechanically simpler for an automated agent than embedded interactive flows.
3.4 AI crawler access and machine-readable content
Two conditions determine whether AI systems can use a website as a source: whether they may access it, and whether its content is machine-readable once accessed. The audit measured both.
Access is nearly universal. 1,762 sites (90.9%) publish a robots.txt file; the remaining 177 publish none and therefore express no crawler restrictions. Among sites with robots.txt, exactly one (0.1%) disallows all major AI crawlers. Individually, GPTBot is not disallowed on 97.2% of those sites, ClaudeBot on 97.3%, and PerplexityBot on 99.7%. 89.9% of sites publish a sitemap. The three crawlers audited are among the most widely deployed AI user agents; the five schema types below are those most relevant to lodging on schema.org; llms.txt is an emerging convention and carries small weight in the category.
Machine-readable content is sparse. Across the five structured-data types audited (LodgingBusiness, VacationRental, LocalBusiness, FAQPage, and AggregateRating), 1,088 sites (56.1%) expose none. 25.0% publish any lodging-specific type; 13.6% publish VacationRental; 8.6% LocalBusiness; 3.2% LodgingBusiness; 2.6% FAQPage. AggregateRating, the most common single type, appears on 30.4%. An llms.txt file with plausible content is present on 20.6% of sites (399); this figure is content-validated: 141 additional sites return an HTML page at the llms.txt path (a single-page-application catch-all response) and are counted as not having one.
Overall, 94.8% of sites score below 50 on the AI-readiness category.
3.5 Trust signals
Evidence for this section was sampled from each site's homepage and one property page.
693 sites (35.7%, n=1,939) display no guest reviews in the sampled pages. Among the 1,246 sites that do, 22.2% (276) display review dates that are fresh or recent, 8.9% (111) display dates classified as stale, and 68.9% (859) display no review dates at all. Displayed review implementations break down as: aggregate widgets 583, Google-sourced 317, custom implementations 301, Airbnb 25, TripAdvisor 15, Trustpilot 5.
Contact and identity signals are frequently absent: 64.0% of sites publish no physical address, 13.0% no phone number, and 11.7% no email address; 2.2% publish none of the three. 30.2% present no detectable social media profiles.
3.6 Mobile first-viewport presentation
Each site's homepage was captured at a mobile viewport and analyzed visually; after excluding 75 obstructed captures and 20 sites without a completed mobile analysis, 1,844 captures form the basis of this section.
On the first viewport, the screen a visitor sees before scrolling, 27.3% of sites present no booking call-to-action, 61.1% present no reachable date picker, and 88.1% display no pricing. Where a booking CTA is present (n=1,340), low visual prominence is rare: 4.3% score 2 or below on a 5-point prominence scale. The dominant observed pattern on the mobile first viewport is absence of booking elements, not poor presentation of present ones.
A measurement note applies: the capture covers the homepage first viewport only. Pricing and booking controls may exist deeper in these sites, and date-dependent pricing can be impractical to present on a multi-property homepage; this section measures what is presented at entry.
3.7 Performance and search visibility
PageSpeed data was obtained for 1,727 sites (absent for 212, 10.9%); of these, 1,720 returned a Lighthouse performance score. The median mobile Lighthouse performance score is 57; 27.8% of sites score below 50 and 1.7% score 90 or above. Field largest-contentful-paint data, available for all 1,727 sites with PageSpeed data, shows a median LCP of 8.7 seconds; 86.5% of sites exceed the 2.5-second threshold Google defines as passing. Lighthouse performance scores are lab measurements; the LCP figures are CrUX field data. Each is reported at its stated n.
Search visibility estimates derive from SEMrush (n=1,938). Median estimated organic search traffic is 0 visits per month; the 75th percentile is 44 and the 90th percentile is 729. 79.9% of sites receive fewer than an estimated 100 organic visits per month. The median domain authority score is 6, and 87.6% of sites score below 20. These figures estimate unpaid search-engine traffic only; branded navigation, direct visits, social referrals, and paid traffic are outside their scope. Third-party traffic estimation is least reliable for low-traffic domains; figures at the bottom of the distribution indicate very low visibility rather than precise counts.
3.8 Quartile comparison
Comparing the top and bottom quartiles of the audited sample by overall score, category-mean gaps order as follows: conversion +62.3 (75.4 vs 13.1), content +19.8 (65.0 vs 45.2), trust +18.9, AI readiness +7.3, performance +2.2, and SEO −0.1.
Two structural comparisons complete the picture. By estimated portfolio size, mean overall scores rise modestly with scale: 47.5 for single-unit operators (n=279), 50.0 for 2–5 units (n=280), 51.5 for 6–20 units (n=198), and 52.5 for more than 20 units (n=66). By country, means are similarly close: United States 47.7 (n=1,507), Germany 45.2 (n=93), Canada 45.7 (n=21), United Kingdom 44.3 (n=29).
This flatness is not an artifact of score construction. On raw SEMrush metrics, the pattern repeats: median estimated organic traffic is 1 visit per month in the top quartile against 0 in the bottom, median authority score is 6 in both quartiles, and the correlation of log-scaled organic traffic with the overall score is 0.02 (n=1,939; missing traffic treated as zero). Nor is the instrument blind within the dimension: the SEO category score correlates 0.71 with log-scaled traffic. The category's mean can sit near 49 despite near-zero traffic because roughly half of its points are technical-hygiene items most sites earn, and its outcome metrics are log-compressed; the raw-metric robustness above is reported for precisely this reason. And the flat gap is not a weighting artifact: performance carries the second-largest category weight (20%, tied with trust) yet shows a +2.2 gap while trust shows +18.9. Where the tails differ at all, they run counter to the headline ordering: 90th-percentile authority is 24 in the bottom quartile against 16 in the top; some low-scoring sites are established businesses with meaningful search authority.
Two measurement notes apply. First, conversion carries the largest weight in the overall score (25%); a conversion gap between quartiles defined by overall score is therefore partly mechanical, and this section reports between-group gaps only, without causal interpretation. Second, category scales are separately calibrated, and gaps are reported in native category points. Quartile boundaries follow the analysis pipeline's convention; independent recomputations may differ within rounding at the boundaries, and the published aggregate file (§6) is canonical.
4. Limitations
Framework coverage. Of the five conditions in the motivating framework, retention is not externally observable and proposition is observable only at its presentation surface (whether a price is shown, not whether it is competitive). Findings therefore describe the observable conditions (acquisition, trust, and payment) plus supporting infrastructure, not the framework in full. Table 0 states the boundary.
Sample construction. The sample was drawn at random from a database of approximately 15,000 operator domains assembled from PMS-ecosystem lists and a benchmark list; findings estimate that population directly. Extension to the STR industry beyond the database depends on how well the database represents it. The sample is predominantly U.S. (78%) and, where size is identifiable, predominantly small operators; the per-source robustness check (§2.4) bounds sensitivity to list composition.
Automated measurement. The booking agent measures machine-navigability. Its completion rates are a floor on human completion, not an estimate of it: a determined human completes journeys the agent cannot. The agent classified 47.6% of sites as meaningfully navigable, and all funnel figures should be read with that scope in mind. All threshold-clearing sites received manual human review, which produced one exclusion and two reclassifications (§2.5); broader stratified human validation of the classifiers and agent outcomes is planned.
Sampled evidence. Trust signals were sampled from two pages per site, and mobile findings cover the homepage first viewport only. Both measure presentation at entry, not the full site. Signals absent from sampled pages may exist elsewhere.
Third-party estimates. Performance and search figures depend on external measurement systems (Google Lighthouse/CrUX and SEMrush) with their own coverage gaps and estimation error, largest for low-traffic domains, reported at stated n.
Instrument thresholds. The direct-ready threshold and score bands are the instrument's own published calibration. The rubric's weights, band definitions, and summary criteria appear in Appendix 1, and the aggregate data file (§6) publishes every underlying figure, so readers who prefer different thresholds can re-band the results. The bands have not yet been validated against independent expert ratings or realized booking outcomes; both validations are planned.
Point in time. All audits were conducted July 13–14, 2026. Websites change; these findings are a snapshot.
5. Discussion
The following three paragraphs are interpretation, stated separately from the findings.
Differentiation concentrates at the payment condition. The largest top-to-bottom-quartile gap by a wide margin is conversion (+62.3), the operationalization of the payment condition; content (+19.8) and trust (+18.9) follow at under a third of that size. Acquisition-mapped signals are mixed: search visibility shows no gap (−0.1), machine-readable discovery a small one (+7.3), and content, which Table 0 maps to both acquisition and proposition presentation, the second-largest. Performance, measured as supporting infrastructure, is negligible (+2.2). In this population, high-scoring sites are distinguished above all by whether a guest can complete a transaction on the site, and are essentially undifferentiated on search visibility and speed. Two population properties, offered as interpretation, are consistent with that flatness: site performance varies little across the population (consistent with commoditized delivery through shared platforms, it spans 47–71 at the 10th–90th percentiles and lands within about two points across quartiles), and search visibility is uniformly near-absent, with median estimated organic traffic of zero and median authority of 6. A signal that is near zero for almost everyone cannot separate quartiles.
Off-site checkout is associated with substantially lower conversion scores. Sites that route guests to a third-party domain at the moment of payment score 27.8 points lower on the conversion category than sites that keep the transaction on-domain. The association is consistent in direction across the six source lists containing sites in both groups: five show gaps of 25 to 32 points, one small list (53 classified sites) shows essentially none (+0.6), and the seventh list contains no off-site sites to compare. This is an observational association, not a causal estimate, and it is partly definitional: the conversion score deducts points where checkout leaves the operator's domain, so a portion of the gap restates the instrument's definition of booking capability rather than independently observed behavior. Architecture choice additionally correlates with other operator characteristics this audit does not measure.
Sites are open to AI systems but largely illegible to them. Crawler access is near-universal while explicit machine-readable signals are sparse: the audited sites are accessible to AI systems but provide few of the signals those systems parse. Whether this gap becomes commercially material depends on the trajectory of AI-mediated travel discovery, which this audit does not measure. External research indicates that trajectory is steep: Phocuswright reports that 56% of U.S. leisure travelers used AI for trip planning, booking, or in-destination assistance in the twelve months to early 2026, up from 43% in late 2025 (Phocuswright 2026). If that adoption is borne out, the 56.1% of sites exposing none of the audited structured-data types are weakly represented, in machine-readable form, within a channel they do not restrict.
6. Citation, data, and versioning
Cite as: hostAI Research (2026). The State of STR Direct Booking Readiness 2026. gethostai.com/reports/str-direct-booking-readiness-2026. Version 1.0, July 2026.
Data availability. The aggregate statistics file (aggregates-v1.json), containing every figure published in this report with its n and filter definition, is available for download alongside this report. Row-level data, including per-domain scores, is not published, to preserve the anonymization described in §2.6.
Authorship. This report was produced by the hostAI Research team.
Competing interests and funding. This research was designed, conducted, and funded by hostAI, which develops the Scan instrument used here and sells products intended to improve several of the measured dimensions. The instrument, thresholds, and analysis pipeline are hostAI's. This interest is disclosed so readers can weigh it; the aggregate data file, the rubric summary, and the publicly runnable instrument exist so that every claim can be checked independently.
Reproducibility. Audits ran July 13–14, 2026 on the production hostAI Scan system, with the scoring code, the LLM-driven browser agent, and the third-party measurement services frozen for the audit window. Exact version identifiers, the scoring-code commit, and the full agent protocol are available to researchers via [email protected]. Because the instrument is publicly runnable on any domain, the measurement itself can be independently reproduced on any sample.
Versioning and corrections. This page carries a changelog. Errors identified after publication are corrected in place and logged there.
Contact. Methodology questions: [email protected].
Appendix 5. Agent protocol (summary)
The agent executes one standardized natural-language task specification, identical across all sites: locate a bookable property, select dates, and proceed to checkout. It stops at the checkout stage and executes no payment. Outcomes are recorded per stage (navigable, property located, dates selected, checkout reached), together with the observed checkout destination and a conversion-confidence rating. Full protocol parameters (requested dates, guest count, step limits, retry policy, viewport) are available to researchers via [email protected].
References. Phocuswright (2026). The AI Surge: Travel's Fastest Behavioral Shift in a Decade. March 2026. https://www.phocuswright.com/Travel-Research/Research-Updates/2026/The-fastest-shift-in-travel-behavior-just-became-the-default Google. Largest Contentful Paint (LCP) and the 2.5-second threshold. https://web.dev/articles/lcp Schema.org. Vocabulary for structured data. https://schema.org IETF RFC 9309. Robots Exclusion Protocol. https://www.rfc-editor.org/rfc/rfc9309 llms.txt. Proposed convention for LLM-readable site guidance. https://llmstxt.org
Appendix 1. Scoring rubric and bands
The overall score is a weighted composite of six category scores, each 0–100. Weights are those of the production scoring system, confirmed against the scoring code. "Signals include" summarizes each category's principal measured inputs, verified against that code; exact point assignment within categories is not published. The aggregate data file (§6) publishes every figure needed to verify this report's claims.
| Category | Weight | Signals include |
|---|---|---|
| Conversion | 25% | An evidence hierarchy rather than a checklist: vision analysis of rendered screenshots ranks first, the booking agent's behavioral journey second, static HTML analysis as fallback; independent evidence types must corroborate, and each audit records a conversion-confidence rating reflecting how many agreed. Fixed deductions apply where checkout completes off the operator's domain. |
| Performance | 20% | Mobile Lighthouse performance (the large majority of the category) plus minor technical checks; a conservative, capped fallback applies where no measurement was obtained, so missing data cannot outrank measured sites. |
| Trust | 20% | Displayed guest reviews (source, rating, volume, recency), contact and identity signals (phone, email, address, about page), trust badges, social profiles and social proof, policies. Absence is scored as "not visible in sampled pages," never as proof of absence. |
| Content | 15% | A points checklist across sampled pages: image count, text depth, testimonials and social proof, video, heading structure, amenity lists. |
| AI readiness | 11% | Five weighted subscores: structured data, content structure, authority signals, crawlability (AI-bot access in robots.txt, llms.txt, sitemap), brand presence. |
| SEO | 9% | Meta tags, a technical SEO audit, domain authority, and log-scaled organic traffic, keywords, and backlinks from SEMrush. |
Overall score bands: below 60 Needs Work · 60–66 Fair · 67–74 Good (direct-ready) · 75+ Strong.
Appendix 2. Robustness tables
A2.1 Equal-source weighting (industry, 7 lists). Mean overall 48.1 (vs 47.2 pooled); direct-ready unchanged at 0.6%.
A2.2 Conversion-confidence restriction (industry, medium/high only). n=807; mean overall 51.7; direct-ready 10 (1.2%); Strong 0.
A2.3 Per-source direction check (on-site vs off-site conversion gap). Of the six source lists containing sites in both groups, five show gaps between +25.4 and +32.1 points; one list (20 on-site, 33 off-site) shows +0.6; one list contains no off-site sites. Computed from row-level data per the §2.3 group definitions.
A2.4 Threshold sensitivity (share of the audited sample at or above each cutoff). ≥60: 142 (7.3%) · ≥62: 63 (3.2%) · ≥65: 28 (1.4%) · ≥67: 11 (0.6%) · ≥68: 5 (0.3%) · ≥70: 1 (0.1%) · ≥75: 0. Computed from row-level data on the canonical basis.
Appendix 3. Refusal and exclusion breakdown
Attempted 2,206 · completed 2,013 · retained 2,012 (one post-audit exclusion, §2.5). Not completed (193): did not meet the population definition 95 · unreadable by automated tools 86 (3.9% of attempts) · unresolvable DNS 12.
Appendix 4. Chart data
A4.1 (Chart 1). Band counts, n=1,939: Needs Work 1,797 · Fair 131 · Good 11 · Strong 0. Mean 47.2, median 48, maximum 72; five sites ≥68.
A4.2 (Chart 2). Per Table 1. Grouped: on-site n=721, conversion 67.9, overall 52.8 (weighted across embedded and custom/native); off-site n=504, conversion 40.1, overall 45.0 (weighted across PMS-hosted, behavioral external, dead destination).
A4.3 (Chart 3). 1,939 → 923 (47.6%) → 921 (47.5%) → 378 (19.5%). Clicks to checkout: median 4 (n=90). Cross-domain among captured journeys: 14 of 90 (15.6%).
A4.4 (Chart 4). robots.txt 1,762 (90.9%) · sitemap 1,744 (89.9%) · blocks all AI crawlers 1 of 1,762 (0.1%) · GPTBot allowed 97.2% · ClaudeBot 97.3% · PerplexityBot 99.7% (all of n=1,762) · zero schema 1,088 (56.1%) · any lodging type 485 (25.0%) · AggregateRating 590 (30.4%) · VacationRental 264 (13.6%) · LocalBusiness 166 (8.6%) · LodgingBusiness 63 (3.2%) · FAQPage 51 (2.6%) · llms.txt validated 399 (20.6%), of n=1,939.
A4.5 (Chart 5). Trust (n=1,939): no reviews 693 (35.7%) · no address 1,241 (64.0%) · no phone (13.0%) · no email (11.7%) · no socials (30.2%) · none of phone/email/address (2.2%). Mobile (n=1,844): no CTA 504 (27.3%) · no date picker (61.1%) · no price 1,624 (88.1%) · CTA prominence ≤2/5: 4.3% of 1,340.
A4.6 (Chart 6). Category means, top vs bottom quartile (n=484 per quartile): conversion 75.4/13.1 (Δ+62.3) · content 65.0/45.2 (Δ+19.8) · trust 42.9/24.0 (Δ+18.9) · AI 37.6/30.3 (Δ+7.3) · performance 62.7/60.4 (Δ+2.2) · SEO 49.8/49.9 (Δ−0.1). Portfolio: 1 unit 47.5 (n=279) · 2–5 50.0 (n=280) · 6–20 51.5 (n=198) · 21+ 52.5 (n=66). Country: US 47.7 (n=1,507) · DE 45.2 (n=93) · CA 45.7 (n=21) · GB 44.3 (n=29).
Changelog
Version 1.0, July 19, 2026, initial publication.
Where does your own site stand?
hostAI Scan, the instrument used in this report, is free to run on any website.
Run your free scan