

airbnb stats by city
Airbnb Stats by City: 7 Best Data Sources (2025)
Posted on Dec 27, 2025
TL;DR: If you run a short-term rental portfolio, city-level data on ADR, occupancy, and forward pacing is how you price ahead of the market instead of reacting to it. The seven sources below cover every budget and use case, from free raw datasets (Inside Airbnb) to enterprise destination intelligence (Transparent, Key Data). But the data itself isn't the edge. The edge is what you do with it: turning a demand signal into a pricing move and a direct-booking campaign before your competitors notice the same trend.
Quick answer: which Airbnb city-stats tool should you use?
Here's the decision matrix most operators actually need. Match your situation to a tool, then read the detailed breakdown below.
| If you are… | Best fit | Cost model |
|---|---|---|
| A manager pricing an existing portfolio | PriceLabs or Key Data | Per-market subscription / quote |
| An investor underwriting new properties | AirDNA or Mashvisor | Tiered subscription |
| Doing hyperlocal, neighborhood-level analysis | Airbtics | Affordable tiered plans |
| A large operator or DMO benchmarking destinations | Transparent or Key Data | Enterprise / custom quote |
| A technical analyst who wants raw data, free | Inside Airbnb | Free (CSV/GeoJSON downloads) |
One note before you spend a dollar: the value of any "airbnb stats by city" analysis is only as good as the dataset under it. Scraped-listing platforms estimate booked revenue from observed prices; first-party co-ops (like Key Data) use confirmed reservations. Know which you're buying, because mispriced nights and misdirected ad spend both trace back to bad inputs. AirDNA's data methodology overview is a useful primer on how listing-level scraping becomes market-level estimates.
Now the detailed breakdown of the seven platforms — their features, pricing, and the operator use case each one fits.
1. AirDNA
AirDNA is the closest thing the short-term rental industry has to a default data source. It tracks over 10 million Airbnb and Vrbo properties across more than 120,000 markets globally (AirDNA), and its numbers are the ones most often quoted when you read an STR market report on Skift or a hospitality forecast. For investors, managers, and municipalities, that breadth makes it a foundational tool for accessing detailed airbnb stats by city. Its core strength is the pairing of historical performance with forward-looking pacing.
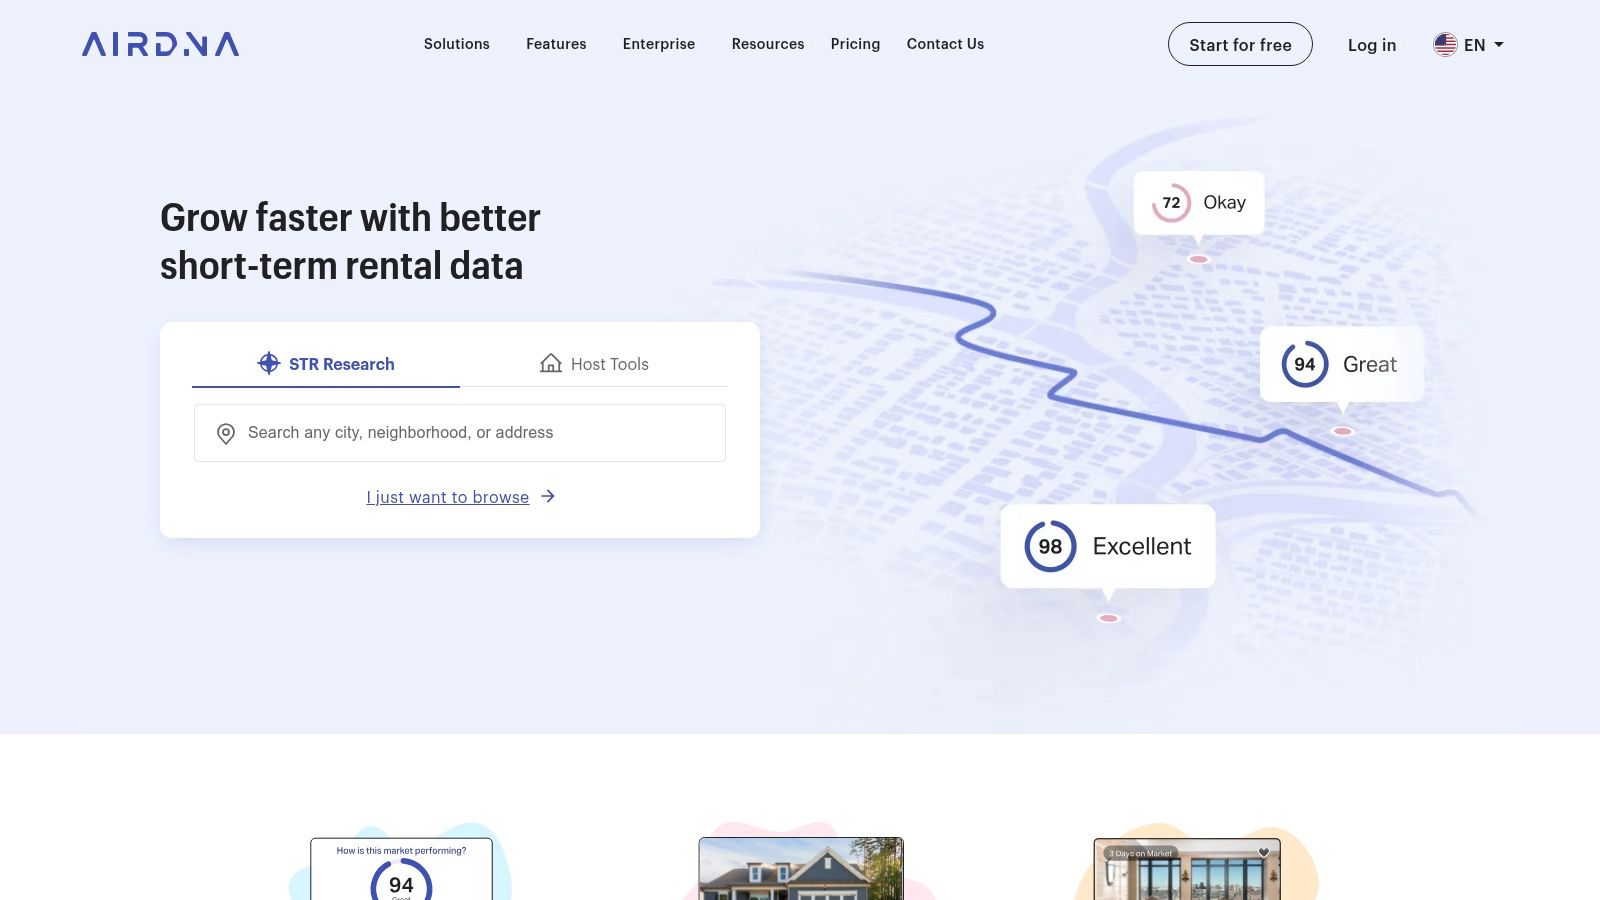
What sets AirDNA apart is its dual focus on macro-level market intelligence and micro-level property analysis. For managers and investors evaluating new markets, the MarketMinder tool surfaces city- and neighborhood-specific KPIs like ADR, occupancy, and RevPAR. For optimizing an existing property, Rentalizer generates revenue projections for any specific address.
Key Features and User Experience
The interface is clean and data-rich, presenting complex analytics through intuitive dashboards, charts, and maps. That makes it relatively easy to spot trends, benchmark against competitors, and pinpoint high-demand periods.
- MarketMinder: Analyze city-level metrics, seasonality, and regulatory impacts.
- Rentalizer: Address-specific revenue, occupancy, and ADR estimates.
- Forward-Looking Pacing Data: See rates and occupancy for future dates, so you price your own listings proactively.
- Custom Comp Sets: Track a curated list of competitor properties to inform pricing and marketing.
Pricing and Access
AirDNA runs on a tiered subscription. Granular data for a single market starts at a lower price point; global or multi-market access requires a higher tier.
| Plan Tier | Ideal User | Key Feature Access |
|---|---|---|
| Market-Specific | Single-market hosts, investors | Deep data for one city/region |
| Multi-Market | Property managers, enterprise teams | Access to multiple or global markets |
| Enterprise | Large operators, municipalities | Custom data solutions and APIs |
Cost can be a factor if you analyze multiple cities, but the depth and forward-looking nature of the data usually pays back through better pricing and market selection.
Website: https://www.airdna.co/
2. PriceLabs (Market Dashboards)
PriceLabs extends its dynamic-pricing expertise into market analysis with self-serve Market Dashboards. It's an accessible, cost-effective way to visualize key airbnb stats by city — or within a custom-drawn geography. Pulling from both Airbnb and Vrbo, it's a clean way to monitor local trends and build recurring owner or executive reports without connecting individual listings.
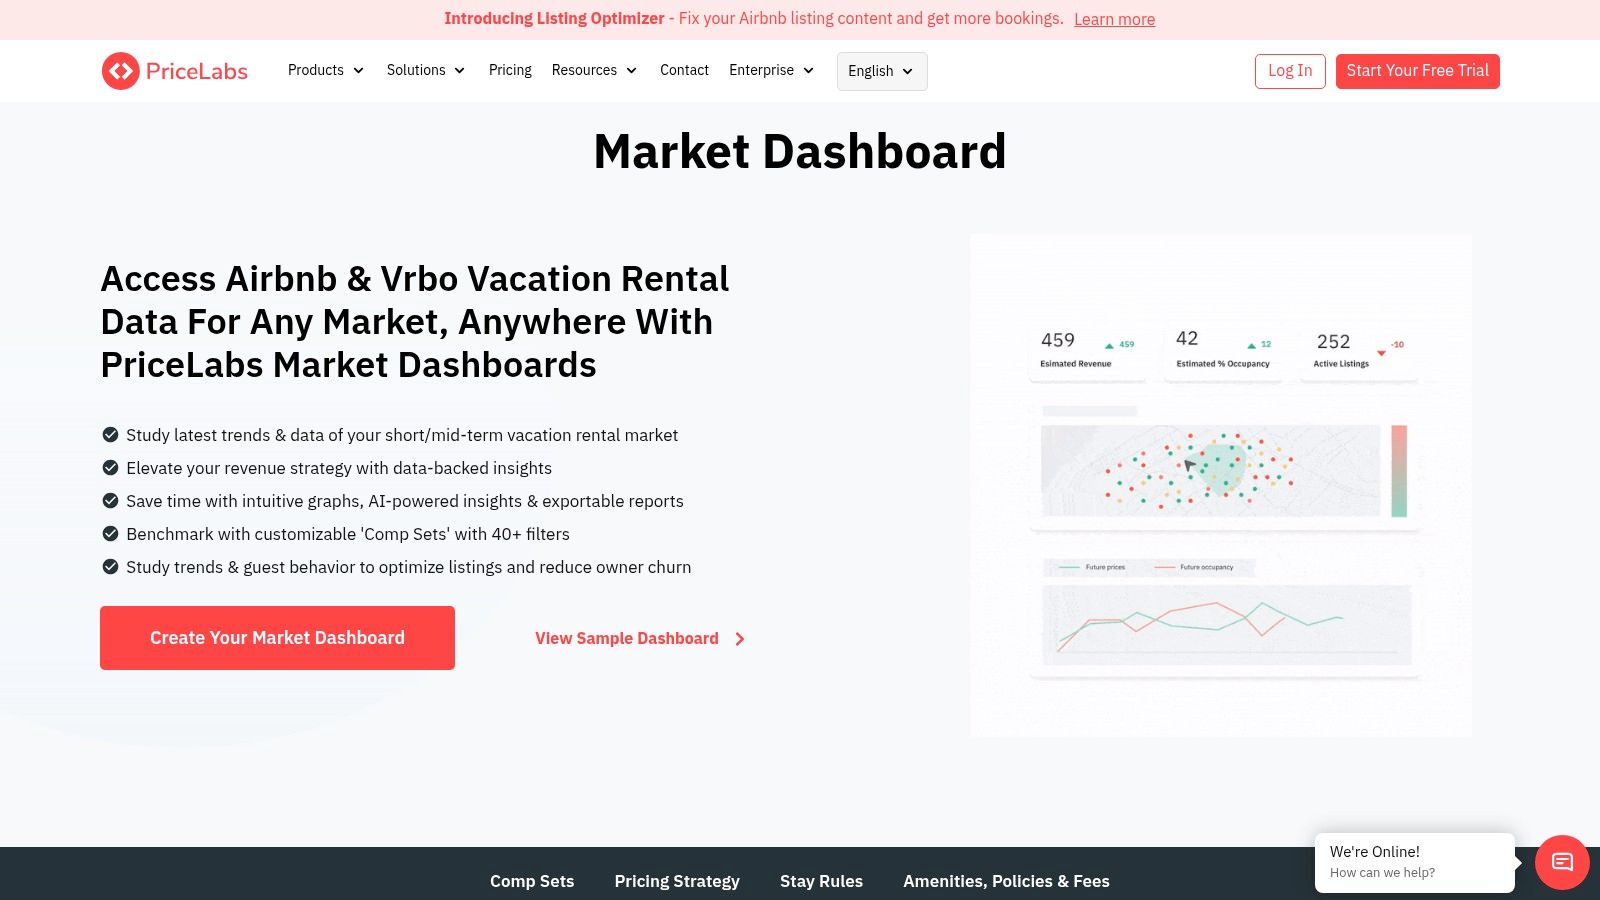
What makes it distinct is the seamless link to PriceLabs' core pricing and portfolio analytics. You can move from high-level market observation straight to actionable pricing adjustments in the same ecosystem — particularly valuable if you want your vacation rental pricing strategy informed by real-time occupancy pacing and booking-window trends.
Key Features and User Experience
The experience is built for clarity and speed. Dashboards present KPIs through clean, exportable charts perfect for owner reports. Custom geographies — say, a radius around a landmark — enable hyper-local analysis beyond standard city boundaries.
- Comprehensive KPIs: Occupancy, ADR, RevPAR, booking volume, booking window, and length of stay (LOS).
- Custom Comp Sets: Over 40 filters to build a precise competitor set.
- Flexible Geographies: Ready-made dashboards for major markets, or draw your own.
- Forward-Looking Pacing: Compare future booking trends against historical data.
Pricing and Access
Market Dashboards are known for affordability, on a per-market subscription. That makes them accessible for managers or investors focused on one or a few areas without a costly global package.
| Plan Tier | Ideal User | Key Feature Access |
|---|---|---|
| Single Market | Individual hosts, small managers | Full dashboard for one defined market |
| Multi-Market | Growing property managers, investors | Bundled pricing for multiple dashboards |
| Enterprise | Large-scale operators, data analysts | Custom solutions and API access |
One caveat: it works best in markets with 300+ listings to keep data clean, and it assumes the observed Airbnb price equals the booked price, which can nudge revenue precision. For speed, ease, and the direct link to pricing actions, the value is hard to beat.
Website: https://hello.pricelabs.co/market-dashboards/
3. Inside Airbnb
Inside Airbnb takes a transparent, civic-tech approach to airbnb stats by city. It publishes free, downloadable raw datasets for many major cities — invaluable for data scientists, urban planners, journalists, and technically-inclined operators who want to run their own deep-dive analyses. The data is scraped from the public Airbnb site, giving a granular, listing-level snapshot at specific points in time.
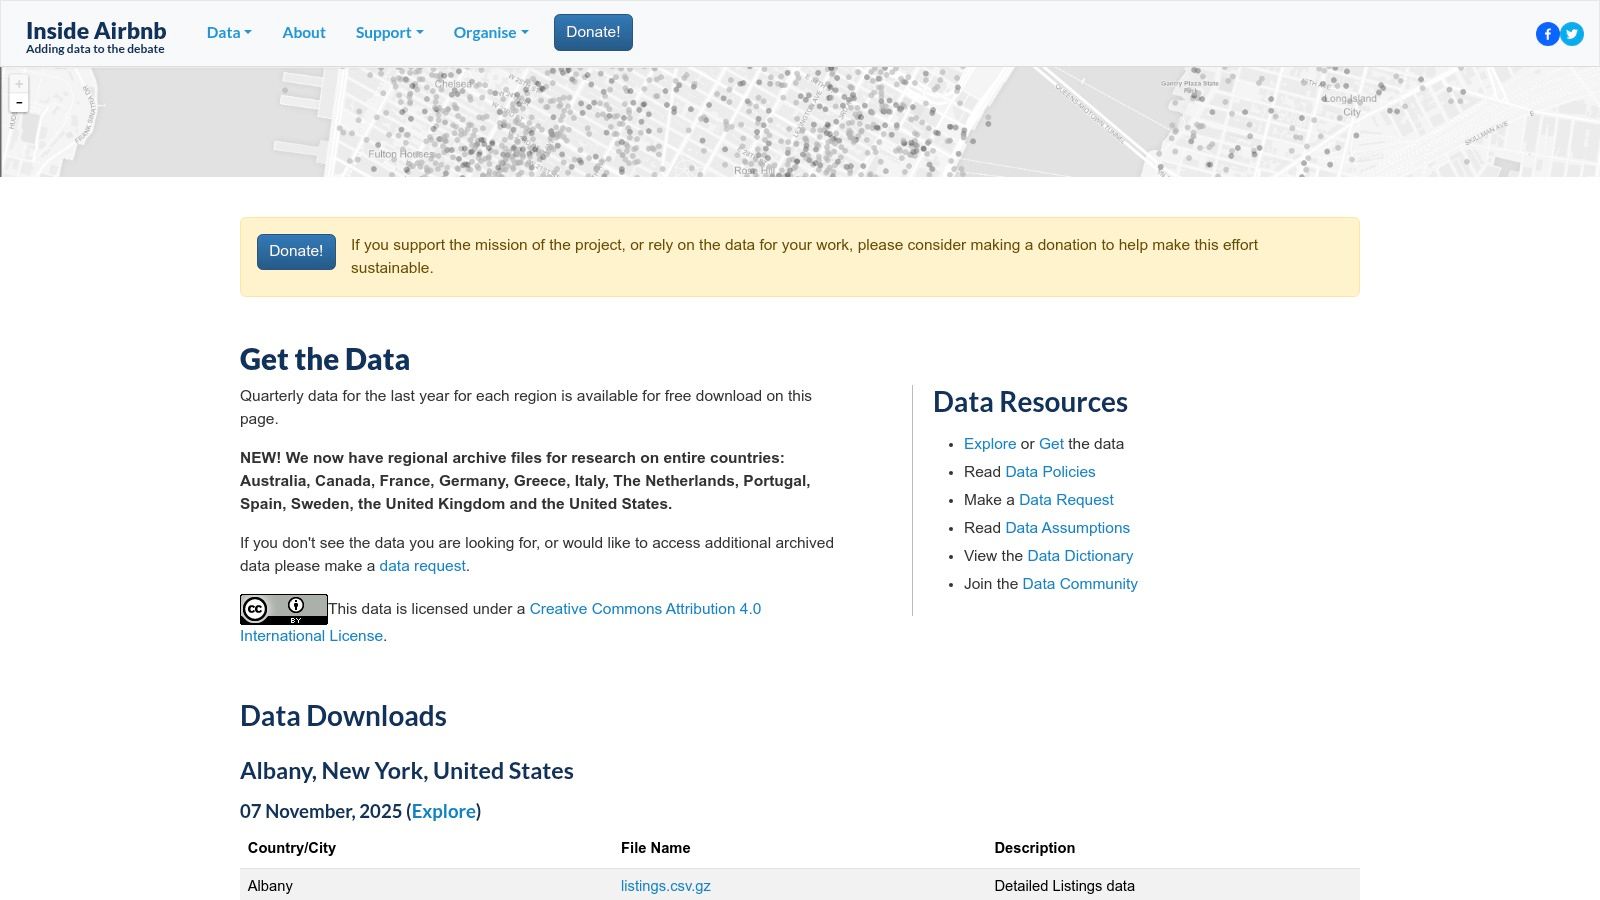
Its distinguishing feature is the open-data mission. You get complete CSV files — listings, host info, calendar availability, reviews — so you can move past pre-packaged KPIs and ask nuanced questions about rental types and host activity. For an operator with analysis skills, it's a goldmine for custom competitive reports, a theme that runs through our guides on hosting an Airbnb.
Key Features and User Experience
This is data retrieval, not interactive analysis. The site is a repository of files by city; you'll need Excel, SQL, or Python to process them.
- Raw Data Downloads: Detailed CSV files for listings, calendars, and reviews across dozens of cities.
- Geospatial Files: Neighborhood boundaries in GeoJSON, ready for mapping.
- Historical Snapshots: Date-stamped data for longitudinal analysis.
- Open and Transparent: Free for non-commercial use.
Pricing and Access
Completely free — the opposite of the subscription platforms. That makes it a go-to for academic research, policy work, and budget-conscious analysts.
| Aspect | Details |
|---|---|
| Cost | Free to download and use for non-commercial purposes. |
| Data Format | Raw CSV and GeoJSON requiring external tools. |
| Ideal User | Analysts, researchers, journalists, technical hosts. |
The trade-off for free access is no friendly dashboard and no real-time data — these are periodic snapshots, with update frequency varying by city. But for anyone who can handle raw data, the depth and freedom are unmatched.
Website: https://insideairbnb.com/get-the-data/
4. Transparent (by OTA Insight)
Transparent, part of OTA Insight, delivers enterprise-grade market intelligence built for larger property managers, destination marketing organizations (DMOs), and multi-market teams. It tracks millions of listings across Airbnb, Vrbo, and Booking.com to produce powerful airbnb stats by city, excelling at a strategic, high-level view: destination benchmarking, supply evolution, and forward-looking demand signals.
What distinguishes it is competitive and destination-level analysis. You can benchmark your primary market against competitor cities — invaluable for DMOs and large investors assessing regional opportunities. Multi-OTA coverage gives a more holistic read on demand and supply than Airbnb alone.
Key Features and User Experience
Built for professional analysts, with sophisticated visualization and exportable datasets. Clear methodology and documentation give confidence in the data's integrity.
- Destination Dashboards: Occupancy, ADR, booking windows, and LOS trends for a city.
- Forward-Looking Pacing: Future demand and occupancy on the books for upcoming months.
- Competitor Market Benchmarking: Compare your city against a curated set of competing destinations.
- Visitor Origin Data: See where guests come from to focus marketing.
Pricing and Access
Enterprise-focused, priced to match depth and scope. Access usually runs through a demo and custom quote — best for organizations that need a tailored solution rather than off-the-shelf.
| Plan Tier | Ideal User | Key Feature Access |
|---|---|---|
| Property Manager | Multi-property operators, larger teams | Advanced competitive benchmarking, pacing data |
| Destination | DMOs, tourism boards, municipalities | Visitor origin data, market supply trends |
| Enterprise | Hotel groups, investment funds | Custom API access, extensive datasets |
The investment is significant, but teams managing large portfolios or promoting a whole destination will find the forward-looking intelligence essential.
Website: https://seetransparent.com/
5. Key Data
Key Data takes a different route to airbnb stats by city: it prioritizes first-party data from a cooperative of professional property managers, blending direct reservation feeds with OTA and hotel data. That produces a highly accurate signal for benchmarking — especially useful for managers and DMOs who need trustworthy numbers to make strategic calls.
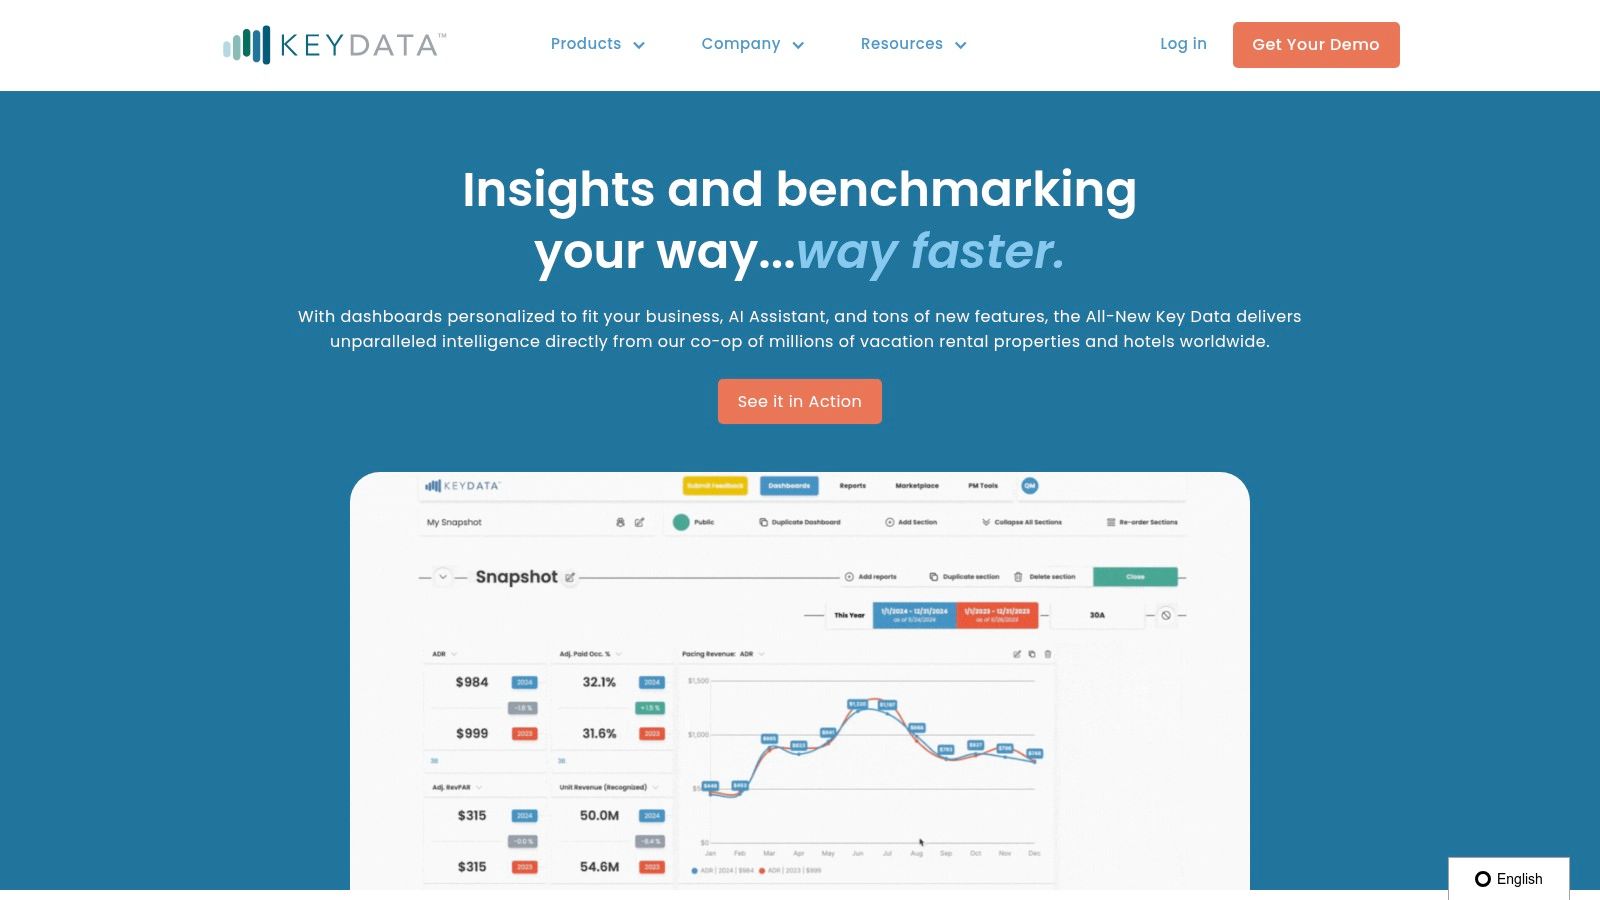
The co-op model means the dataset is built on actual confirmed bookings rather than scraped listings, which sharpens accuracy on pacing, occupancy, and revenue. Distinct product lines — ProData for managers, DestinationData for tourism boards — tailor the KPIs to each audience.
Key Features and User Experience
Customizable dashboards track over 45 KPIs, so you monitor exactly what matters — historical performance through forward-looking pacing against your comp set. The experience is built for professional analysis.
- First-Party Data Co-op: Direct reservation data from managers improves accuracy.
- ProData & DestinationData: Tailored suites for managers and DMOs.
- Customizable KPIs: 45+ metrics on historical and forward-looking dashboards.
- Competitive Pacing Views: Future booking activity vs. your market and competitors.
Pricing and Access
No standard public pricing — access comes via consultation and quote, sized to your portfolio. Best for multi-unit managers and DMOs, where value scales with portfolio size.
| Plan Tier | Ideal User | Key Feature Access |
|---|---|---|
| ProData | Professional Property Managers | Portfolio benchmarking, competitive analysis, pacing |
| DestinationData | DMOs, Tourism Boards | Market-wide intelligence, visitor trends, economic impact |
Less accessible for a single-listing host given the quote model, but for multi-property operators, the quality of first-party data makes it a formidable benchmarking tool.
Website: https://www.keydatadashboard.com/
6. Airbtics
Airbtics carves out a niche in highly granular, neighborhood-level analytics — powerful for anyone who needs to understand micro-markets. Where many platforms stop at city-wide data, Airbtics breaks airbnb stats by city down to the zip code or custom-drawn boundaries, so you can move past general trends into the precise blocks where your properties actually compete.
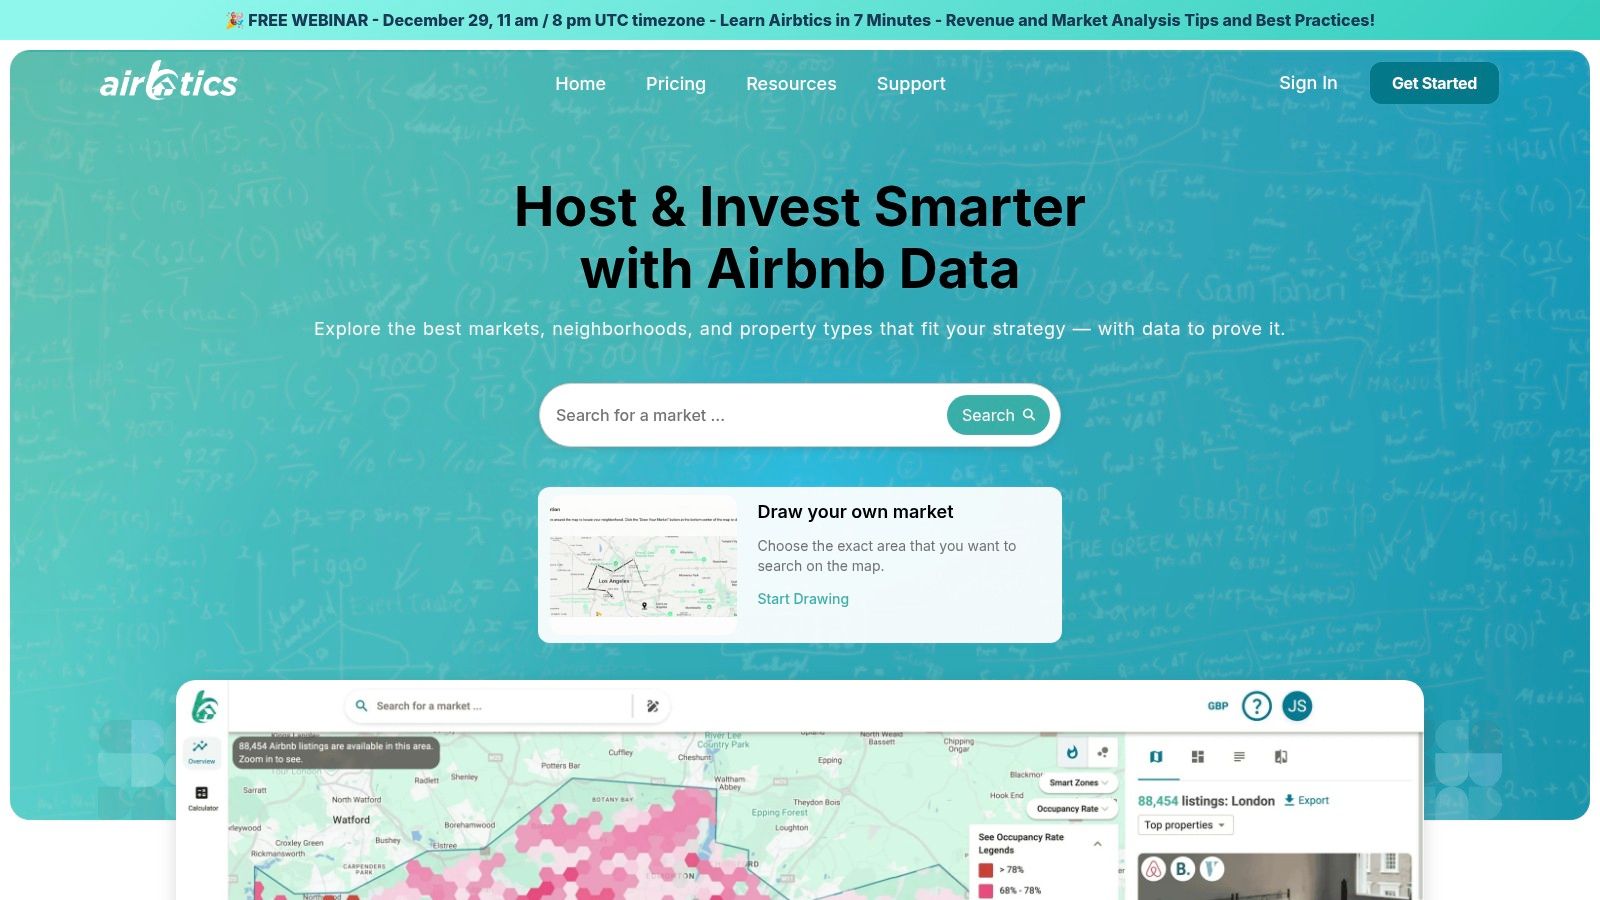
Its standout is the draw-your-own-submarket tool, ideal for identifying undervalued pockets or mapping the exact competitive landscape around a property. Paired with investment calculators and three years of historical data, it lets you treat STRs with the analytical rigor of traditional real estate — while managers can use the same hyperlocal view to set neighborhood-accurate rates.
Key Features and User Experience
The map-centric UI makes for quick visual scans — easy to spot pockets of high occupancy or ADR a spreadsheet would bury.
- Market Explorer: Interactive maps of occupancy, ADR, and revenue at the neighborhood level.
- Custom Submarket Drawing: Draw a polygon to get aggregated data for a self-defined area.
- Investment Calculators: ROI, cash-on-cash, and other financial metrics.
- Three Years of Historical Data: Context for seasonality and long-term trends.
Pricing and Access
A competitive model — often broad city-level access for what others charge for a single market. An accessible entry point for analyzing multiple U.S. cities, though advanced features sit in higher tiers.
| Plan Tier | Ideal User | Key Feature Access |
|---|---|---|
| Starter | New hosts, initial researchers | Basic city and neighborhood stats |
| Pro | Serious investors, small managers | Custom submarket drawing, investment tools |
| Business | Large operators, data analysts | API access, full dataset downloads |
Its strength is the blend of accessibility and hyperlocal power. Data for smaller rural markets can be thin, but for major and mid-sized urban areas, the value is exceptional.
Website: https://airbtics.com/
7. Mashvisor
Mashvisor focuses squarely on the U.S. real estate investor and host, engineered to translate short-term rental data into investment metrics like cash-on-cash return, cap rate, and projected rental income. That makes it valuable when you're scouting, underwriting, and comparing acquisition opportunities across neighborhoods and cities.
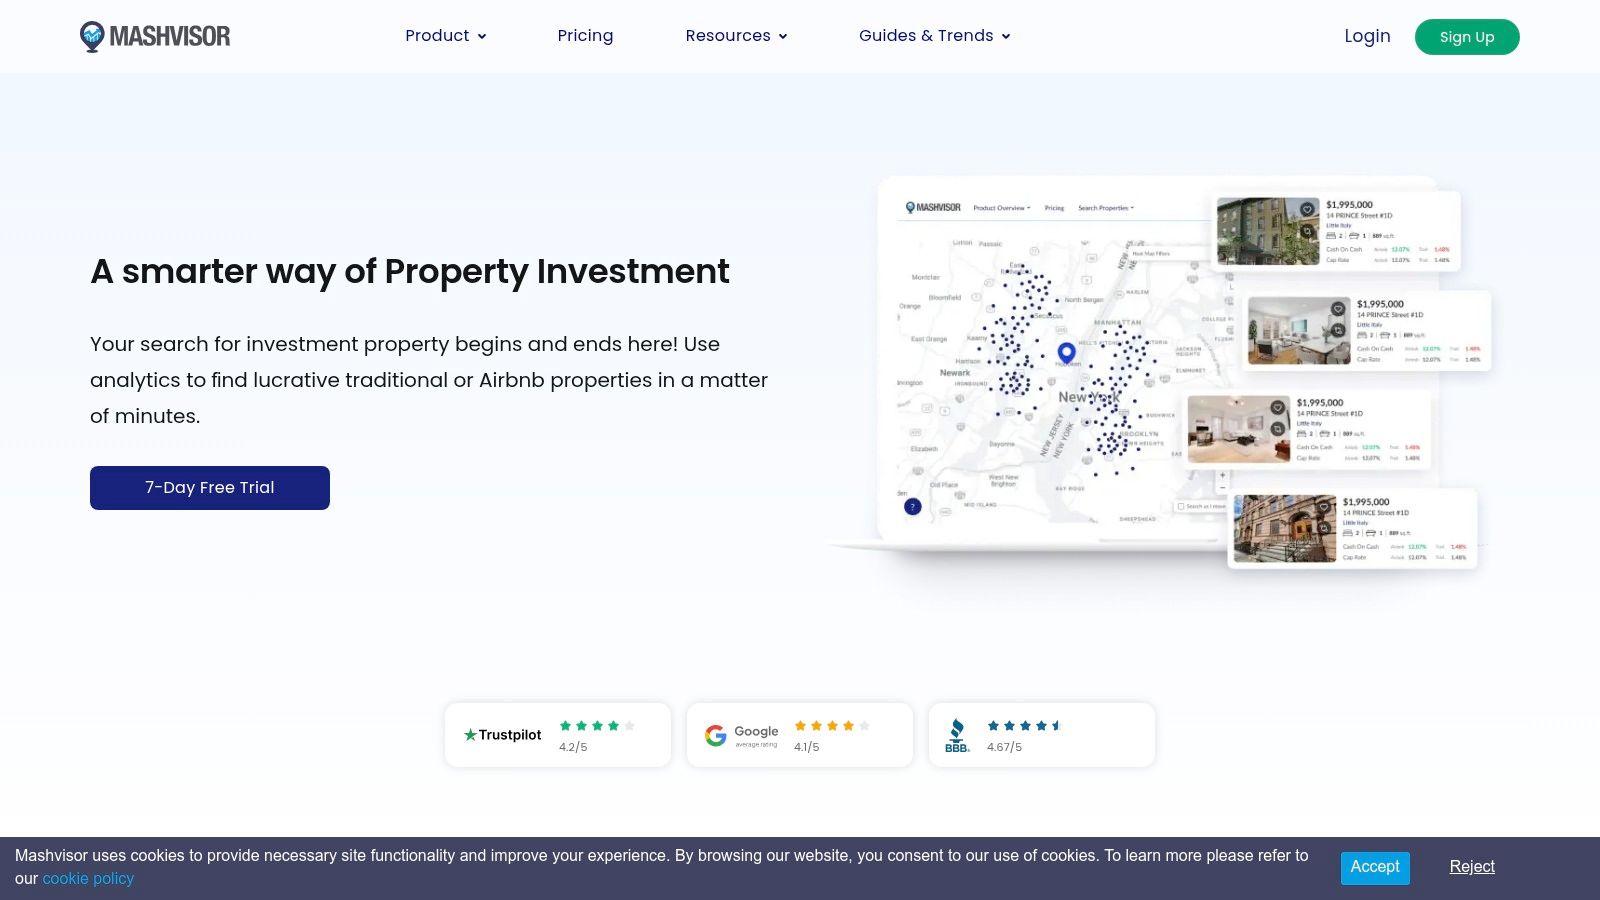
Where it shines is the initial analysis phase: quickly identifying promising neighborhoods, analyzing comparable performance, and calculating projected ROI for a specific address. If you're starting a vacation rental business, that underwriting data is foundational.
Key Features and User Experience
A straightforward workflow from city comparisons down to property-level projections, using heatmaps and dashboards to rank and filter neighborhoods by ROI.
- Neighborhood Analytics: Heatmaps and tables comparing occupancy, rental income, and home prices.
- Airbnb Calculator: Estimates income potential, cash flow, and ROI for any U.S. property.
- Property Finder: Search on-market (MLS) and off-market properties with STR potential.
- Exportable Reports: Rental comps, financial calcs, and market data for presentations.
Pricing and Access
A tiered subscription, generally more affordable than enterprise analytics platforms, especially for its U.S.-focused dataset.
| Plan Tier | Ideal User | Key Feature Access |
|---|---|---|
| Lite | New investors, single-market analysis | Basic property analysis, neighborhood data |
| Standard | Active investors, agents | Advanced analytics, property finder, data export |
| Professional | Real estate teams, high-volume investors | Full access, multiple seats, market reports |
Global coverage is limited and the data leans toward underwriting over real-time dynamic pricing, but for U.S.-focused investment scouting, the value proposition is clear.
Website: https://www.mashvisor.com/airbnb-analytics-tool
Airbnb City Stats: 7-Tool Comparison
| Product | Implementation complexity | Resource requirements | Expected outcomes | Ideal use cases | Key advantages |
|---|---|---|---|---|---|
| AirDNA | Moderate — ready dashboards; advanced features behind tiers | Paid subscription; higher tiers for address‑level tools; multi‑market costs can add up | Address‑level revenue projections, benchmarking and forward‑looking pacing (ADR, occupancy, RevPAR) | Investors, property managers, municipalities for market research and revenue forecasts | Broad global coverage; forward‑looking pricing/demand data; clear plan tiers |
| PriceLabs (Market Dashboards) | Low — self‑serve, fast setup | Low‑cost per‑market subscription; no listing connection required | City‑level KPIs and visual market trends for recurring reporting | Owners, small PMs, executive/owner reporting without linking listings | Affordable; clear visualizations; integrates with PriceLabs dynamic pricing |
| Inside Airbnb | High — raw data requires analysis skills | Free CSV/geojson downloads; needs spreadsheet/SQL/coding for use | Transparent raw listing, calendar and review data for custom analysis and visualizations | Researchers, analysts, civic tech projects, programmatic workflows | Free and transparent data source; widely cited for civic research |
| Transparent (by OTA Insight) | Moderate–High — enterprise onboarding and demos | Enterprise pricing; sales/demo driven; multi‑market focus | Destination benchmarking and forward‑looking rate/demand projections across OTAs | Large property managers, DMOs, multi‑market analytics teams | Strong competitor/destination benchmarking; robust methodology and documentation |
| Key Data | Moderate — dashboarding with co‑op integration | Requires co‑op reservation feeds or subscription; demos/quotes typical | Accurate pacing and competitive performance from first‑party reservation data | Property managers and DMOs operating at portfolio scale | First‑party data improves signal quality; widely adopted by PMs/DMOs |
| Airbtics | Low — intuitive UI and map tools | Affordable plans; some advanced features gated to higher tiers | Neighborhood and micro‑area analytics with investment calculators | Investors, hyperlocal analysis, SEO and micro‑market exploration | Competitive price; draw‑your‑own‑market feature; easy, map‑based UI |
| Mashvisor | Low — simple investor workflows | Transparent, affordable U.S.‑focused tiers | ROI metrics (cap rate, cash‑on‑cash), occupancy/ADR estimates for underwriting | U.S. investors and hosts scouting multi‑city opportunities | Investor‑focused tools; transparent pricing; multi‑city scouting workflows |
From City Stats to Direct Bookings: Where the Data Actually Pays Off
Here's the part most tool roundups skip. A dashboard tells you your market's occupancy is pacing 8 points ahead of last year for August. So what? The operators who win don't stop at knowing — they turn that signal into a pricing move and a marketing campaign while everyone else is still scrolling.
Two plays separate the market leaders from the rest:
- Price ahead of the pace, on your own channel. When forward-looking pacing data shows demand building for a date range, raise rates early — but do it where you keep the margin. Every night you book on Airbnb now carries a 15.5% host-only service fee after the platform's October 2025 fee change (PriceLabs). A night you fill through your own direct-booking site keeps that 15.5% in your pocket. Pacing data is most valuable when it feeds a channel you actually own.
- Build shoulder-season campaigns from the data, not from hope. If your city stats show a soft October that historically fills late, that's your cue to run a targeted email campaign to past guests and a geo-focused ad set weeks ahead — not an eight-weeks-out scramble at a discount. Visitor-origin data (from Transparent or Key Data) tells you exactly which regions to target.
The catch: market data and OTA bookings live in different worlds. AirDNA can tell you demand is coming, but if every booking still routes through Airbnb, you never own the guest, the email address, or the rebooking. This is where a direct-booking engine matters — hostAI turns those market signals into action by giving you a high-converting direct site plus automated guest email and ad campaigns, so the demand you spotted in the data lands on a channel you control instead of one that taxes every reservation.
Key Takeaways
- Proactive, not reactive: Use forward-looking pacing to anticipate demand. A festival 10 months out should shape your pricing and marketing now, not eight weeks before everyone else scrambles.
- Hyper-local focus: City stats are useful; neighborhood data is where the edge lives. Drill into your zip code or district.
- Competitor analysis is opportunity analysis: Don't just benchmark — find their gaps (thin amenities, weak photography, mispriced shoulder weeks) and take that demand.
- Own the guest the data sends you: Visitor-origin data is a marketing goldmine — but only if the booking lands on a channel where you keep the guest relationship and the margin.
Bottom Line: Your data tool shouldn't be a one-time research project. Make it part of your weekly operating rhythm — a recurring "data dive" reviewing market pace, your KPIs, and upcoming bookings — and route the demand it surfaces toward direct bookings, not just more OTA volume.
Ready to turn city-level insights into a direct-booking machine? hostAI helps you act on market data with a high-converting direct site and automated email and ad campaigns — so you stop letting the OTAs own your guest relationships and start building your own brand. See how at gethostai.com.