
how to calculate occupancy rate
How to Calculate Occupancy Rate for Your STR Business
Posted on Dec 30, 2025
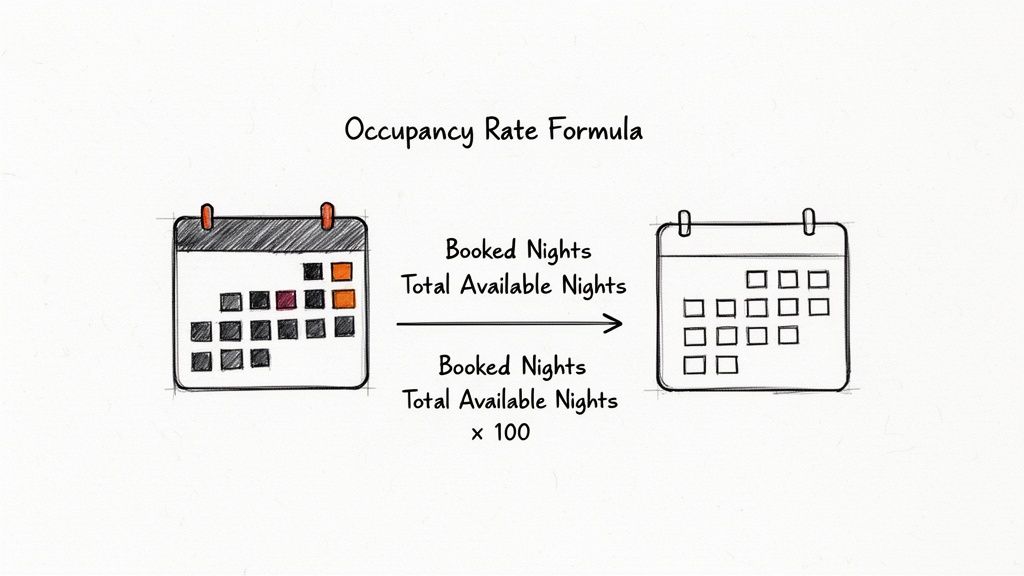
At its heart, the occupancy rate formula is simple: you divide the number of nights your property was booked by the total number of nights it was available to be booked, then multiply by 100 to get a percentage.
This calculation is the essential starting point for digging into your short-term rental's real performance and unlocking its potential.
Why Occupancy Rate Drives Your STR Success
Let's be real—occupancy rate isn't just another number to track on a spreadsheet. It's the pulse of your short-term rental (STR) business. This one metric gives you a powerful snapshot of your property's financial health, its standing in the market, and how efficiently you're running things.
Getting a firm handle on this figure directly impacts everything from your top-line revenue and profitability to how you decide to spend your marketing dollars.
When you stop seeing it as just a formula and start seeing it as a tool, you gain immediate, practical power. It’s what allows you to benchmark your performance against the local competition and make smarter, data-backed pricing decisions that can seriously boost your income.
More Than Just a Number
The basic calculation is pretty straightforward. You're just figuring out the percentage of nights your property is booked compared to the total nights it was available. The formula looks like this:
(Booked Nights ÷ Total Available Nights) × 100
So, if your vacation rental was available for all 365 days last year but was only booked for 255 of them, your occupancy rate is (255 ÷ 365) × 100, which comes out to roughly 70%. To see how you stack up, it's worth checking out some of the essential vacation rental statistics from StayFi.
But don't let the simplicity fool you; this number has strategic depth. Think of it as a diagnostic tool. It can uncover hidden opportunities and shine a light on weaknesses in your business strategy. A consistently low rate might be a sign that your pricing is too high, your marketing isn't hitting the mark, or your listing photos just aren't cutting it.
On the flip side, a super high occupancy rate tells a different story. While it feels like a win, it could also mean you're leaving money on the table by pricing your property too low. The goal isn't just to fill every night—it's to maximize revenue.
The Foundation of Strategic Decisions
Your occupancy rate is the bedrock for other critical Key Performance Indicators (KPIs). It's not a standalone metric; it works hand-in-hand with your Average Daily Rate (ADR) and Revenue Per Available Room (RevPAR) to paint the full picture of your success.
Here’s a quick rundown of why it’s so critical:
- Pricing Strategy: It helps you pinpoint high-demand periods where you can—and should—raise your rates. It also shows you the slow times that might need a special promotion or a pricing adjustment to attract guests.
- Marketing Effectiveness: See your occupancy tick up after launching a new ad campaign? That’s how you know what’s working. Tracking these changes ensures you invest your marketing dollars wisely.
- Competitive Analysis: Comparing your rate to the market average helps you understand where you stand. Are you lagging behind or leading the pack? This is how you find your competitive edge.
- Profitability Forecasting: When you have accurate occupancy data, you can create much more reliable revenue projections. This is key for managing cash flow and planning for future investments in your property.
Ultimately, mastering how to calculate occupancy rate is the first step toward turning your STR from a side hustle into a fully optimized, thriving business.
Breaking Down the Occupancy Rate Formula
Alright, let's get our hands dirty. Moving from theory to practice is where you actually start to steer the ship. The occupancy rate formula itself looks simple enough on paper, but its real power comes from how well you define the numbers you plug into it. Getting the details right is what separates a vague guess from a sharp performance metric.
The core formula is this: (Total Nights Booked ÷ Total Available Nights) × 100. Let’s unpack what those terms actually mean when you’re managing a real-world short-term rental.
Defining Your Core Numbers
The two variables you absolutely have to nail are your Booked Nights and Available Nights. If you get these wrong, your data gets skewed, and you could end up making some seriously flawed decisions.
Total Nights Booked: This one is pretty straightforward. It’s simply the sum of all the nights your property was occupied by a paying guest within whatever timeframe you're looking at. For instance, if you had a 5-night booking and a 7-night booking in April, your total booked nights are 12. Easy enough.
Total Available Nights: Here’s where a lot of hosts trip up. This number represents the total nights your property was actually open for business during the period. If you’re calculating for June, which has 30 days, your total available nights are 30—if your calendar was open the whole time.
The classic mistake is just using the total number of days in the month. But what if you blocked off a week for your own family vacation or some much-needed maintenance? Those seven nights were not available for booking. We'll dig into how to handle those adjustments later, but for this basic calculation, only count the nights a guest could have possibly booked.
Key Takeaway: Your occupancy rate is only as accurate as your definition of "available." Before you do any math, get crystal clear on which nights were genuinely on the market.
Applying the Formula Across Different Timeframes
Calculating your occupancy rate isn’t a one-and-done deal. Smart operators look at this metric through different lenses to see the full picture.
A monthly view is perfect for pacing reports. If you see that next month's occupancy is lagging way behind last year's, that’s a flashing red light telling you to maybe run a promotion or tweak your pricing. It’s your short-term tactical tool.
An annual rate, on the other hand, gives you that 30,000-foot view of your property’s performance. This is the big number you'll use to benchmark against the local market and set your long-term business goals.
A Practical Worked Example
Let's walk through a real-world scenario. Imagine you run a single-family vacation home and you want to calculate its occupancy for July, a 31-day month.
First, identify the booked nights. You check your records and see three separate bookings: one for 10 nights, another for 4 nights, and a third for 7 nights. So, your Total Nights Booked are 10 + 4 + 7 = 21 nights.
Next, determine the available nights. The property was open for bookings the entire month with no owner blocks. That makes your Total Available Nights equal to 31.
Finally, run the calculation. Just plug those numbers into the formula:
(21 ÷ 31) × 100 = 67.7%
Your occupancy rate for July was 67.7%. Now you have a concrete number you can use to compare against your goals, your performance last July, or what similar properties in your area are pulling in.
Moving Beyond the Basic Calculation
The standard occupancy rate formula is a great starting point. It gives you a solid, high-level snapshot of your performance. But if you stop there, you're leaving money on the table. The most successful operators I know dig deeper to find the actionable insights that truly reveal the health of their business.
To get that clearer picture, we need to talk about the Adjusted Occupancy Rate.
This refined calculation helps you understand your performance based only on the days your property was genuinely available for guests to book. Think of it as filtering out the noise created by nights you intentionally took the property off the market.
Introducing the Adjusted Occupancy Rate
The basic formula is a bit blunt—it treats all unbooked nights the same. But was a night empty because nobody booked it, or because you blocked it off for a deep clean? The adjusted formula understands the difference.
It’s a simple but powerful tweak to the original:
Adjusted Occupancy Rate = (Booked Nights) ÷ (Total Nights - Unavailable Nights) × 100
This adjustment is a game-changer. It shows your true operational efficiency by focusing only on the days you were actually trying to get a booking. The key is subtracting those planned "unavailable" nights—like owner stays, maintenance blocks, or renovations—from your total inventory. This simple shift provides a much truer measure of market demand for your property.
Why This Nuance Matters
Let's walk through a real-world example. Imagine your cabin was booked for 18 nights in a 30-day month. You also blocked 5 of those nights for a personal family trip.
Here's how the numbers shake out:
- Standard Calculation: (18 ÷ 30) x 100 = 60% Occupancy
- Adjusted Calculation: (18 ÷ (30 - 5)) x 100 = (18 ÷ 25) x 100 = 72% Occupancy
That’s a massive difference. A 60% rate might make you think market demand is weak, maybe even prompting you to lower your prices. But the 72% rate gives you the real story: on the days you were open for business, you were actually performing quite well.
This isn't about fudging the numbers to feel better. It's about gaining clarity. The adjusted rate helps you separate your personal use of the property from its actual business performance, which is absolutely critical for making smart, strategic decisions.
Occupancy Is Not the Ultimate Goal
It's tempting to get hyper-focused on hitting a 100% occupancy rate. We've all been there. But a full calendar doesn't automatically equal maximum profit. This is where other crucial metrics, like your Average Daily Rate (ADR) and Revenue Per Available Room (RevPAR), have to enter the conversation.
Chasing that elusive 100% occupancy by constantly slashing your prices can seriously backfire. Sure, you might fill every single night, but the increased wear and tear on your property, higher cleaning costs, and razor-thin profit margins often make it a losing game.
The real goal is finding that sweet spot where your occupancy and nightly rate work together to maximize your total revenue. A property that's 85% occupied at a $300 nightly rate is far more profitable than one that’s 100% occupied at $200.
If you want to go deeper on this balancing act, our complete guide on building a smarter vacation rental pricing strategy is the perfect next step. A strong, adjusted occupancy rate is a vital tool in your arsenal, but remember, it's just one piece of the profitability puzzle.
Putting Your Calculations into Practice with Spreadsheets
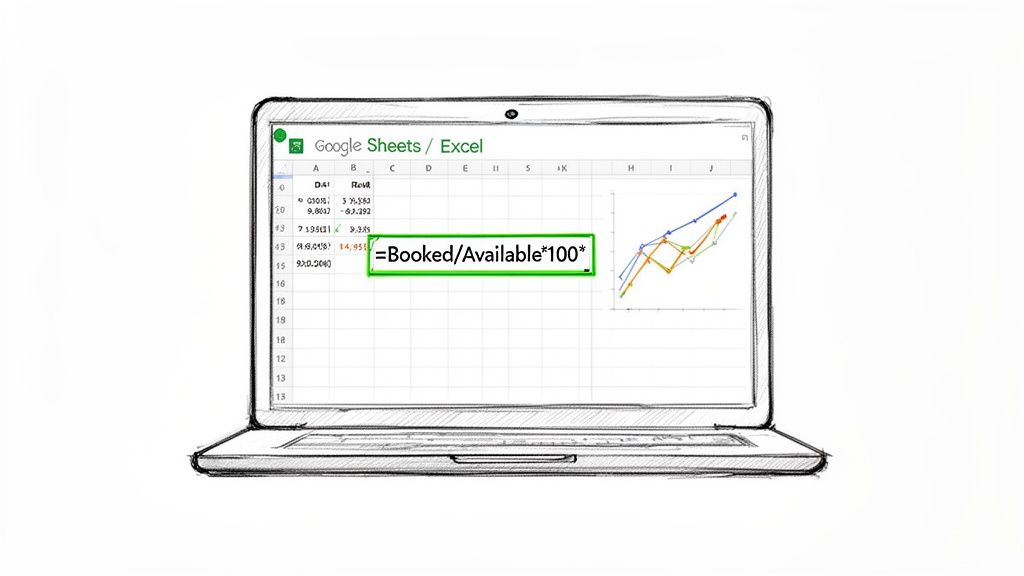
Theory is great, but there's nothing quite like seeing the numbers laid out in a clean spreadsheet. That’s where the real insights happen. Sure, you could track occupancy manually, but it's tedious and a recipe for mistakes. A simple spreadsheet in Google Sheets or Microsoft Excel automates the whole thing, giving you instant, accurate results you can actually use.
This approach lets you build a simple dashboard to keep a pulse on your business. You can spot trends, compare how you did this summer versus last, and start making decisions with real data—no expensive software needed.
Setting Up Your Occupancy Tracker
First things first, you need a simple table to log your bookings. Just create a few columns: Property Name, Booking Start Date, Booking End Date, and Nights Booked. This is the bedrock for all your calculations.
To make things easier, you can have the Nights Booked column calculate itself. In both Excel and Google Sheets, if your end date is in cell C2 and your start date is in B2, the formula is just:
=C2-B2
This little bit of automation means you're not stuck counting days on a calendar, and it keeps your data nice and clean.
Calculating Monthly Occupancy for a Single Property
Let's walk through an example. Imagine you want to calculate the July occupancy for a beachfront condo. We know July has 31 days. Your spreadsheet might look something like this:
| Property Name | Booking Start Date | Booking End Date | Nights Booked |
|---|---|---|---|
| Beachfront Condo | 7/1/2024 | 7/8/2024 | 7 |
| Beachfront Condo | 7/12/2024 | 7/19/2024 | 7 |
| Beachfront Condo | 7/22/2024 | 7/28/2024 | 6 |
To get the total nights booked in July, the SUM function is your best friend. If your "Nights Booked" are in cells D2 through D4, the formula is:
=SUM(D2:D4)
This gives you a total of 20 booked nights. Now for the easy part: divide that by the 31 available nights in July and format the cell as a percentage.
The whole formula in a single cell would look like this:=(SUM(D2:D4)/31)
And just like that, you have an occupancy rate of 64.5%.
By setting up this simple system, you can replicate the calculation for every month and property. This turns a manual chore into a quick copy-and-paste job, giving you back valuable time to focus on strategy.
Calculating Portfolio-Wide Occupancy
This is where the magic really happens, especially if you manage more than one property. You can easily roll up the numbers to calculate your entire portfolio's occupancy rate, giving you a bird's-eye view of your business's health. It’s a critical metric for seeing how you're performing overall and benchmarking yourself against the competition. To get a feel for how your numbers stack up, check out these insightful Airbnb stats by city.
Let's say you manage five urban apartments. For a 30-day month like September, your total available nights would be 5 properties x 30 days = 150 nights.
You'd use the same SUM function to add up all the booked nights across all five properties for that month. If your total comes to 115 booked nights, your portfolio-wide occupancy formula is simply:
=115/150
That gives you a portfolio occupancy rate of 76.7%. This single number is a powerful indicator of your market penetration and how well your operations are running.
Using Occupancy Data to Drive More Bookings
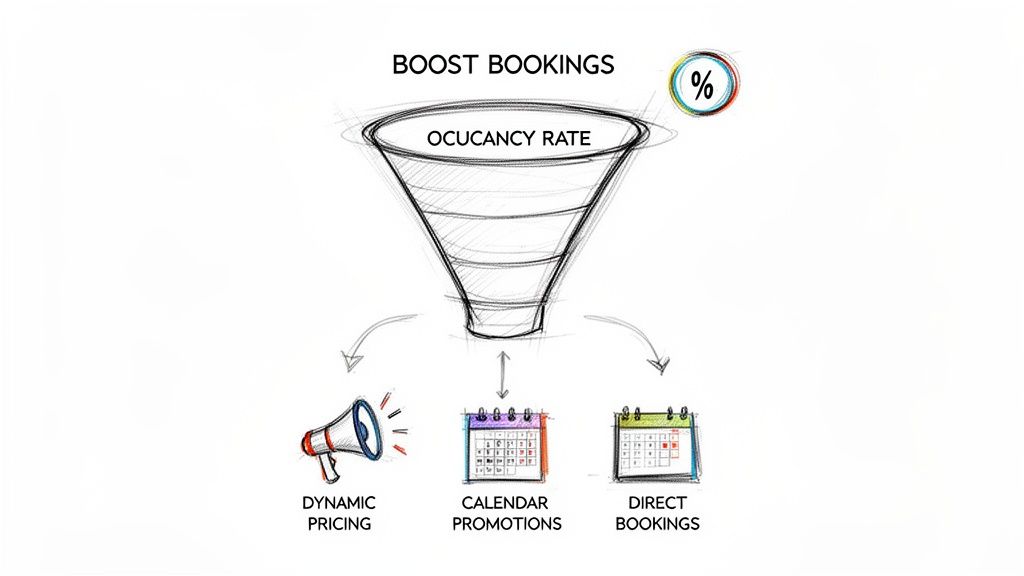
Knowing how to calculate your occupancy rate is one thing. Turning that number into a real growth strategy is where your business really starts to take off. This data isn't just a report card for how you've done; it's a powerful tool for mapping out your future and driving more revenue.
Your calculated rate is most powerful when you give it some context. The first thing you should do is benchmark it. How does your 65% occupancy for last month compare to the same month last year? And just as importantly, how does it stack up against similar properties in your local market? This comparison tells you whether you're leading the pack or have some ground to make up.
Turning Insights into Action
Once you know where you stand, you can build a plan to improve. Low occupancy during your shoulder season isn't just a problem—it's an opportunity. This is where you can get tactical and start filling those empty nights on your calendar.
Consider these proven strategies:
- Implement Dynamic Pricing: Ditch the flat rate and start adjusting your prices based on real-time demand. Lowering rates slightly for mid-week stays or offering a small discount for last-minute bookings can attract guests who might otherwise look elsewhere.
- Launch Targeted Promotions: Got a gap in your calendar coming up? Run a flash sale on social media or send a special offer to your past guest email list. A "stay 3 nights, get the 4th free" promotion is a classic for a reason—it works.
- Build a Direct Booking Engine: Relying solely on OTAs means you're paying hefty commissions on every stay. A direct booking website gives you control over the guest relationship and helps you keep more of your revenue.
A common mistake is thinking you need 100% occupancy to be successful. The real goal is to maximize revenue by finding the sweet spot between your nightly rate and how full your calendar is. An 80% occupancy at a high rate is far better than being fully booked at a deep discount.
The Power of Data-Driven Decisions
Modern tools have made these strategies more accessible than ever. Savvy hosts are increasingly turning to tech to get an edge. In fact, recent findings show that 40% of operators boosted both their occupancy and nightly rates by using dynamic pricing, while nearly 38% saw growth in direct bookings.
Using robust data-driven marketing strategies, informed by metrics like your occupancy rate, is essential for boosting bookings. By analyzing your data, you're no longer just guessing what might work—you're making informed decisions that directly impact your bottom line. To get a better handle on the market forces at play, it's helpful to understand the nuances of vacation rental occupancy rates across different regions and property types.
Unpacking Common Occupancy Questions
Even when you've got the formulas down, putting this stuff into practice always brings up a few tricky questions. Let's dig into some of the most common ones I hear from property managers all the time.
What Is a Good Occupancy Rate for a Vacation Rental?
Honestly, a "good" rate is one of the most relative metrics in our business. It's completely dependent on your market, the season, and even the type of property you manage. A downtown apartment in a bustling city might easily hit 80% year-round, while a seasonal beach house could swing wildly from a packed 90% in the summer to a quiet 30% in the dead of winter.
As a general rule of thumb, a healthy annual benchmark for many vacation rentals lands somewhere between 60% and 80%.
But here’s the real secret: 100% occupancy is almost never the goal. If your calendar is totally booked solid, it's a massive red flag that your prices are too low. The real objective is to find that sweet spot that maximizes your Revenue Per Available Room (RevPAR) by striking the perfect balance between a strong occupancy rate and a healthy Average Daily Rate (ADR).
How Should I Handle Last-Minute Bookings in My Calculation?
Ah, the classic last-minute booking scramble! It can make tracking your numbers in real-time feel like you're trying to hit a moving target. The best practice here is simple: only finalize your occupancy rate for a specific period after that period is officially over. So, you'd calculate May's final, definitive rate on June 1st.
For forecasting, however, you need to be looking ahead. This is where you track your "occupancy on the books." Compare this number to your booking pace at the exact same point last year. Are you 15% behind last year's pace for next month? That’s not a reason to panic—it's a clear, actionable signal to adjust your pricing strategy or maybe launch a targeted promotion to close that gap.
Should I Lower My Price to Increase My Occupancy Rate?
This is such a tempting lever to pull, but it's often a dangerous one. Slashing prices might fill some empty nights on your calendar, but it can just as easily torpedo your total revenue and attract guests who might not be the best fit for your property. A broad, deep price cut should always be a last resort, never your first move.
Instead of a blanket discount, think more surgically:
- Got a slow Tuesday and Wednesday coming up? Offer a specific mid-week discount.
- Want to avoid one-night gaps? Create a "stay 7, pay 6" promotion to encourage longer, more profitable bookings.
- Have a list of happy past guests? Send them a special, private offer to reward their loyalty and secure a repeat booking.
Always remember, the game we're playing is about maximizing RevPAR. A slightly lower occupancy at a much higher nightly rate is almost always going to be more profitable than a completely full calendar at bargain-basement prices.
Ready to turn these insights into more direct bookings? hostAI provides the tools you need to build a powerful online presence and drive revenue. From AI-powered websites to automated email marketing, we help you take control of your business. Discover how hostAI can double your direct revenue.