
short term rental income calculator
Short Term Rental Income Calculator: Forecast Profits With Confidence
Posted on Jan 30, 2026
If you want to forecast your revenue with any real confidence, you need a modern short term rental income calculator. It's the essential strategic tool that goes way beyond a simple spreadsheet by plugging into dynamic market data, giving you a realistic picture of your potential earnings.
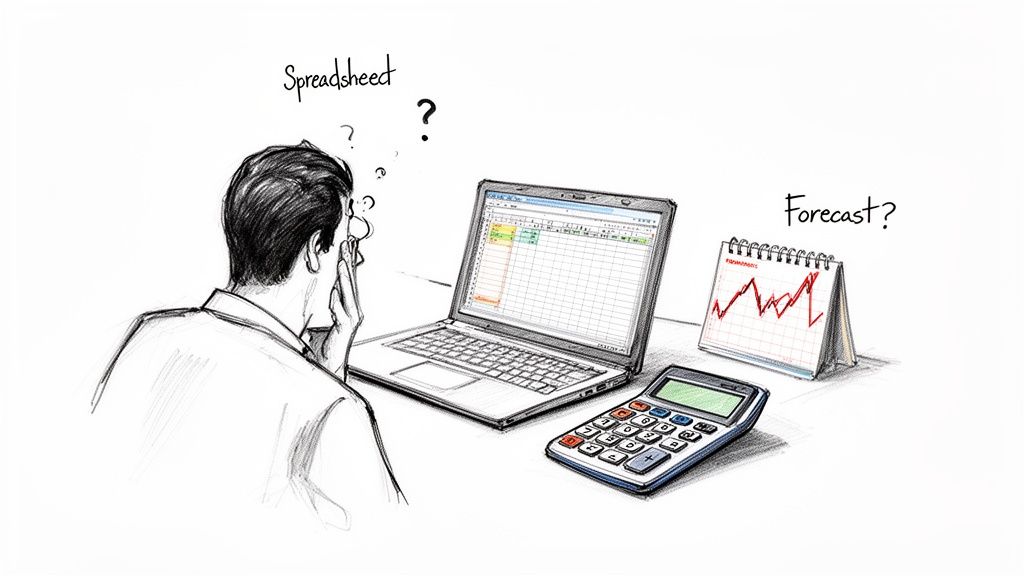
Why Your Spreadsheet Is Costing You Money
We've all been there—staring at a spreadsheet, trying to predict rental income. It feels familiar, but in today's market, it's just a risky guessing game. This old-school approach consistently falls short, leaving hosts like us vulnerable to shifting demand, surprise expenses, and flat-out missed opportunities for more revenue.
Static rows and columns just can't keep up with the real-time rhythm of the market. This leads to pricing that's either too high, scaring away guests, or—even worse—so low you're leaving cash on the table every single night.
For any serious host, moving from reactive estimates to a proactive, data-driven forecast isn't just an upgrade; it's a necessity. It’s all about making smarter decisions, fine-tuning your pricing, and having the confidence to scale your business.
It’s time to trade in the guesswork for a strategy that actually drives profitability.
The Limits of Manual Forecasting
A simple spreadsheet might seem good enough at first glance, but its limitations directly hit your bottom line. The biggest problem? It can't process the sheer volume of data needed for an accurate projection.
Think about these common spreadsheet blind spots:
- Static Data: Your manual entries don't have a clue about a sudden spike in demand from a local festival or how your competitors just slashed their prices for the weekend.
- Hidden Expenses: It’s so easy to forget the small costs that pile up, like payment processing fees, routine maintenance, or restocking all those little amenities.
- Seasonality Oversimplification: Just averaging your ADR and occupancy across 12 months completely hides the massive profit swings between your peak and low seasons.
These little oversights add up, creating a forecast that looks great on paper but falls apart in the real world. This is especially dangerous when the market is growing as fast as it is now.
The global short-term rental market is a testament to this growth, expected to reach USD 140.08 billion in 2025 and projected to skyrocket to USD 408.63 billion by 2035. This explosive expansion, with a robust 11.3% CAGR from 2026, highlights why savvy managers need precise tools to capture their share. You can discover more about these market trends and their implications for investors.
From Guesswork to Growth Strategy
An advanced short term rental income calculator transforms your financial planning from a tedious chore into a powerful strategic tool. It's not just about spitting out a number; it’s about understanding the "why" behind it. By pulling in real-time data on market demand, competitor performance, and seasonal trends, you gain a massive advantage.
This data-first approach empowers you to:
- Identify the most profitable weekends and events to maximize your rates.
- Pinpoint underperforming months where a little marketing push could make a big difference.
- Make informed, confident decisions about property upgrades or even adding another property to your portfolio.
Ultimately, switching to a dedicated calculator is the first real step toward building a resilient and truly profitable short-term rental business. It’s time to swap guesswork for a strategy grounded in solid data.
Sourcing the Data That Actually Matters
Any forecast worth its salt is built on a foundation of solid data, not wishful thinking. Before you even touch a short-term rental income calculator, you need to feed it realistic numbers. This is the first—and most common—place hosts get it wrong. They either pull figures out of thin air or use broad, city-wide averages that have absolutely nothing to do with their specific property’s potential.
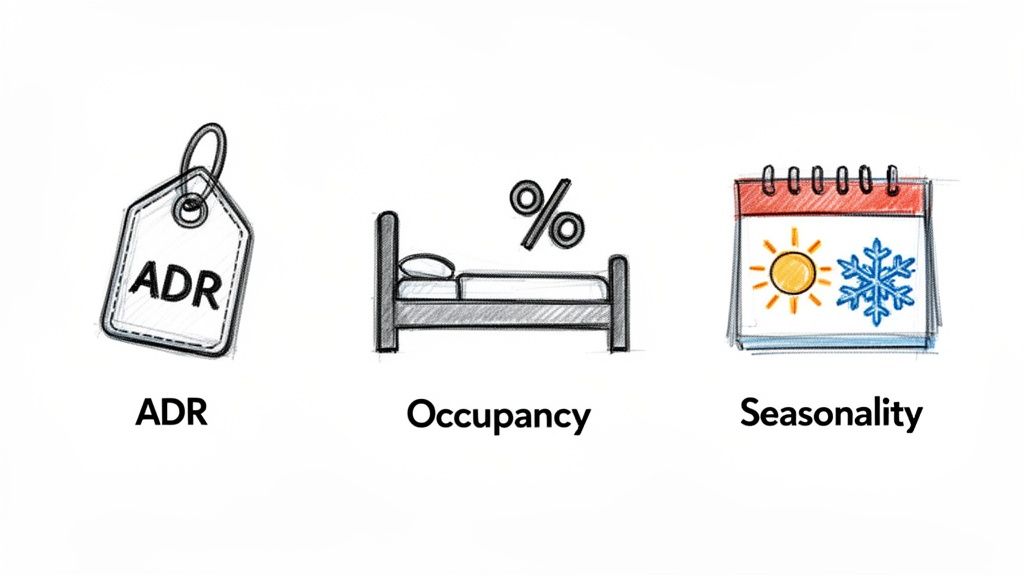
The whole process really hinges on three core metrics: your Average Daily Rate (ADR), your Occupancy Rate, and Seasonal Demand. Getting these right is non-negotiable. Let’s break down how to find this information in the real world, so your final calculation is grounded in reality, not hope.
Finding Your True Average Daily Rate
Your Average Daily Rate isn’t just some arbitrary price you set for a Tuesday in February. It’s the average paid nightly rate over a specific period, and it's probably the most critical input for your income calculator. Digging up a defensible ADR takes a bit of detective work.
Start by becoming a "digital tourist" in your own market. The best way to do this is to open up Airbnb and Vrbo in an incognito browser window and search for properties that are true, direct competitors to yours.
- Property Type: If you have a 2-bedroom condo, only look at other 2-bedroom condos. Don't compare it to a 4-bedroom house.
- Location: Stick to your immediate neighborhood or one with a very similar vibe and proximity to attractions.
- Amenities: Hunt for listings with comparable features. Do they also have a pool, a hot tub, or a dedicated workspace?
Once you've found a few good comps, start clicking through their calendars for the next three to six months. Pay close attention to the pricing differences between weekdays, weekends, upcoming holidays, and any big local events. This hands-on research gives you a powerful, real-world baseline for what guests are actually willing to pay in your hyperlocal area.
Nailing Down a Realistic Occupancy Rate
Occupancy rate is simply the percentage of booked nights out of the total available nights you have. It’s tempting to be optimistic here, but be careful. While a top-performing property in a hot market might hit 70% occupancy or more, assuming you'll achieve that from day one is a recipe for a bad financial surprise. A lower-than-expected occupancy rate can quickly wipe out the benefits of a high ADR.
Your goal is to find a believable occupancy percentage for your specific market and property type. And once again, competitor analysis is your best friend.
Look at the calendars of your top five competitors. How booked up are they for next month? What about three months from now? This gives you a snapshot of current demand. A word of caution, though—a wide-open calendar could just mean the host recently opened those dates, not that there's zero demand. You're looking for patterns, so check several similar properties to get a more reliable picture.
For a deeper dive into this crucial metric, you might be interested in our guide on how to calculate occupancy rate, which offers more advanced techniques and formulas.
Accounting for Seasonal Demand Swings
Perhaps the biggest mistake new hosts make is plugging in a single annual average for both ADR and occupancy and calling it a day. That just doesn’t work. A ski chalet in Colorado is a completely different business in January than it is in July. Ignoring these massive seasonal swings will lead to a wildly inaccurate forecast.
To do this right, you have to break your year down into distinct seasons. For most markets, this usually looks something like this:
- Peak Season: The busiest time of year with the highest demand, ADR, and occupancy (think summer for a beach house).
- Shoulder Seasons: Those in-between periods right before and after peak season, with more moderate demand and pricing.
- Off-Season: The slowest time of year, where you’ll see lower demand and need more competitive pricing to attract what few guests are looking.
For each of these distinct seasons, you'll need to source separate ADR and occupancy numbers. Yes, it’s more work upfront. But this granular approach is the only way to build a forecast that reflects how the rental market actually operates throughout the year. Your annual income is the sum of these distinct periods, not a flat monthly average.
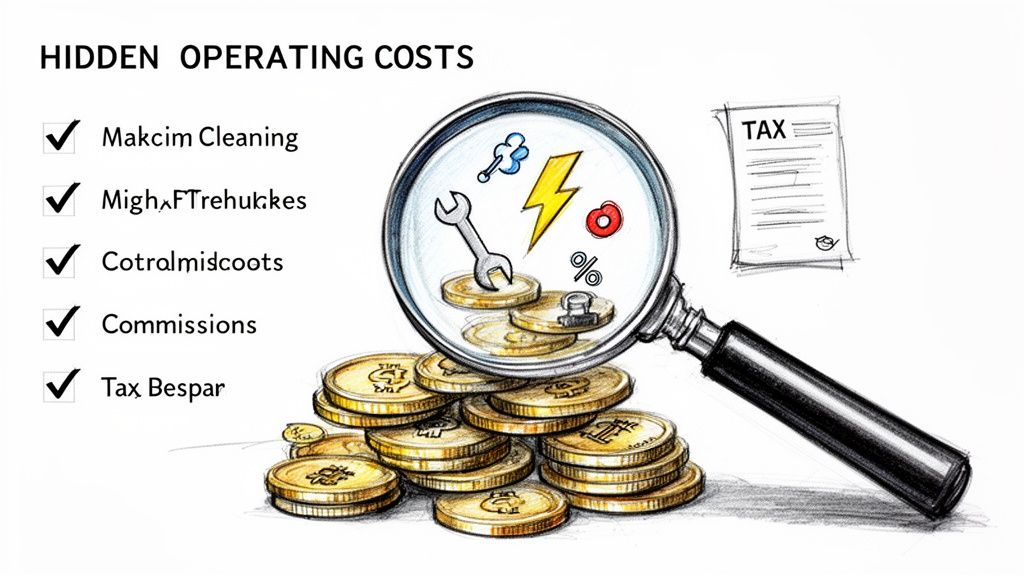
Uncovering the Hidden Costs That Erode Profit
Gross revenue is a vanity metric. It’s the big, flashy number that looks great on a spreadsheet but tells you almost nothing about the health of your actual business. What truly matters is your net profit—the money left in your pocket after every single expense gets paid.
This is exactly where so many hosts get into trouble. They get mesmerized by high nightly rates and packed calendars, only to be blindsided by a swarm of expenses they never saw coming. Let's pull back the curtain on the costs that quietly eat away at your bottom line.
Platform and Management Fees
First up are the most obvious expenses: the fees you pay to the platforms that connect you with guests. Think of these as the cost of admission to a massive, global audience.
- Online Travel Agency (OTA) Commissions: Big players like Airbnb, Vrbo, and Booking.com typically take a cut of anywhere from 3% to 15% of the booking subtotal. For many hosts, this is the single largest variable expense.
- Payment Processing Fees: Don't forget the credit card processing fees, which usually tack on another 2-3% to each transaction.
- Channel Manager and PMS Software: If you're using software to sync your calendars and streamline operations, you need to account for those monthly or annual subscription costs.
These fees come directly off the top, so they have to be the first deduction in any real income calculation.
Direct Operational Expenses
Next up are the hands-on costs of getting your property ready for every new guest. These can swing wildly depending on your property's size and the experience you're trying to create. It's critical to factor in all operational costs, including specialized needs like custom Airbnb cleaning services.
Professional cleaning is simply non-negotiable if you want to maintain great reviews. A standard turnover clean can cost anywhere from $75 to over $300, depending on your market and the size of your space. And that's before you budget for the essential deep cleans a few times a year.
Then you have the consumables—all those small touches that add up to a five-star experience but also add up on your expense sheet. We're talking about everything from toilet paper and coffee to welcome snacks and mini toiletries. A good rule of thumb is to set aside 1-2% of your gross revenue just for restocking these items.
Don't forget the wear and tear on linens and towels. High-turnover properties often need to replace these items annually, which can be a surprisingly large expense if you haven't planned for it.
Utilities and Property Upkeep
Unlike long-term rentals where tenants usually cover their own utilities, in the short-term rental game, that cost falls squarely on you. And remember, these aren't fixed costs; they'll climb right alongside your occupancy rate.
Your utility budget should always include:
- High-speed internet and Wi-Fi
- Electricity and gas
- Water and sewer
- Trash removal
- Cable or streaming service subscriptions
Maintenance is another area that can sink an unprepared host. It’s never a matter of if something will break, but when. The smartest operators I know set aside a maintenance fund—usually 5-10% of their gross monthly revenue—to handle everything from a leaky faucet to a busted HVAC unit.
Comprehensive STR Expense Checklist
To really nail down your profitability, you need a complete picture of every potential cost. Many hosts get caught off guard by the smaller, recurring expenses that add up over time. This checklist covers the usual suspects and some often-forgotten items.
| Expense Category | Specific Item | Estimated Cost / Percentage |
|---|---|---|
| Platform Fees | OTA Commissions (Airbnb, Vrbo) | 3% - 15% of Booking |
| Payment Processing | 2% - 3% of Transaction | |
| Operations | Professional Cleaning | $75 - $300+ per Turnover |
| Consumables (Toiletries, Coffee) | 1% - 2% of Gross Revenue | |
| Linens & Towel Replacement | $300 - $1,000+ Annually | |
| Utilities | Internet, Electricity, Water, Gas | Varies by Usage |
| Streaming Services (Netflix, etc.) | $15 - $50+ per Month | |
| Maintenance | Routine Repairs Fund | 5% - 10% of Gross Revenue |
| Landscaping / Pool Service | $50 - $200+ per Month | |
| Taxes & Compliance | Occupancy / Lodging Taxes | 6% - 15%+ of Nightly Rate |
| Business Licenses & Permits | $50 - $500+ Annually | |
| Property Costs | Mortgage / Rent | Fixed Monthly Cost |
| Property Insurance (STR-specific) | Varies by Provider | |
| Property Taxes | Annual or Semi-Annual | |
| Software & Services | PMS / Channel Manager | $20 - $150+ per Month |
| Dynamic Pricing Tool | 1% of Revenue or Flat Fee |
Using a checklist like this ensures nothing slips through the cracks, giving you a much more realistic—and reliable—profit forecast.
Taxes and Regulatory Hurdles
Finally, we have the unavoidable costs of taxes and compliance. Ignoring these can lead to serious financial penalties, so you need to tackle them head-on. You must account for local, state, and sometimes federal occupancy taxes, which are often called transient or lodging taxes. These can range from 6% to over 15% in popular tourist areas.
The regulatory landscape is also a huge variable. While the short-term rental market is booming, with Airbnb alone reporting over 7.7 million active listings, this growth has triggered tighter rules in many cities and countries. You need to be aware of local laws, licensing requirements, and potential booking caps that could impact your income model.
On the bright side, many of the expenses we've discussed can be deducted from your income taxes. To make sure you're not leaving money on the table, check out our complete guide on essential short-term rental tax deductions.
Building Your Profitability Formula From Scratch
Alright, let's connect the dots. You've got a handle on your potential income streams and a solid list of expenses. Now, we'll put it all together to build a real profitability formula from the ground up. Abstract numbers are fine, but walking through an actual scenario makes everything click.
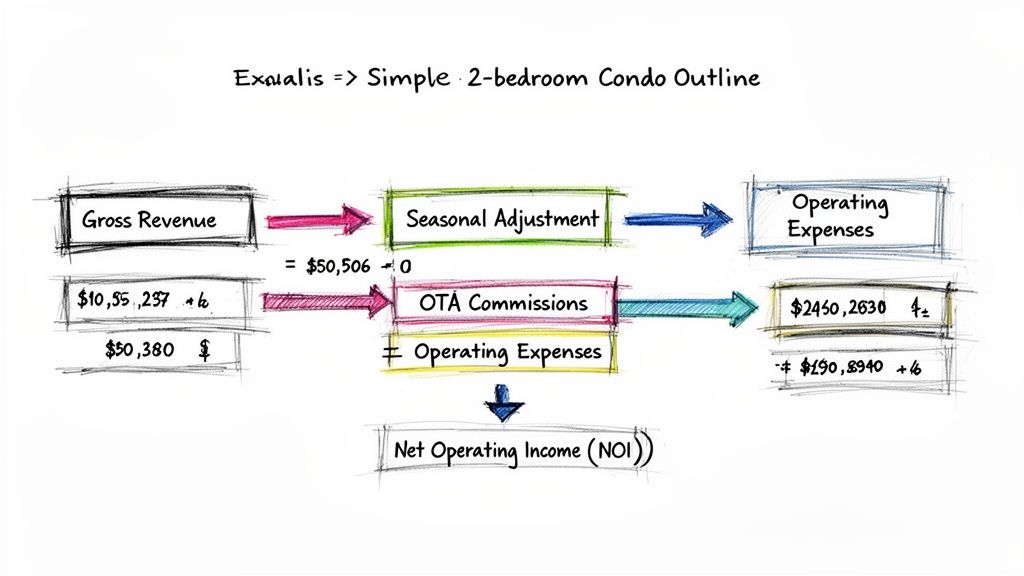
We'll use a classic example: a 2-bedroom, 2-bathroom condo in a busy urban market. First, we'll calculate its gross potential revenue, factoring in the crucial highs and lows of the year. Then, we'll start subtracting the expenses we've identified to get to the real bottom line.
Calculating Gross Potential Revenue Seasonally
Here's the biggest mistake I see hosts make: using a single, year-round average for their rates and occupancy. A profitable business lives and dies by seasonality. For our 2-bedroom condo, let's break the year into two distinct seasons.
Peak Season (6 Months, May-October)
- Average Daily Rate (ADR): $250/night
- Projected Occupancy Rate: 80% (or 24 nights per month)
- Calculation: 24 nights x $250/night = $6,000 monthly gross revenue
Off-Season (6 Months, November-April)
- Average Daily Rate (ADR): $175/night
- Projected Occupancy Rate: 50% (or 15 nights per month)
- Calculation: 15 nights x $175/night = $2,625 monthly gross revenue
Now, let's put those two seasons together to get a realistic annual picture:
($6,000 x 6 months) + ($2,625 x 6 months) = $36,000 + $15,750 = $51,750 Annual Gross Revenue.
This number is our starting line—the absolute maximum this property could earn before a single bill gets paid. It's an exciting figure, but it's definitely not profit.
Subtracting Commissions and Operating Costs
With our gross revenue locked in, it's time to get real about the costs. Let’s start with the biggest variable expense for most hosts: platform commissions. Assuming the bulk of bookings come from a major OTA that charges a 15% commission:
- Annual OTA Commission: $51,750 x 0.15 = $7,762.50
Next up are the direct operational expenses. Based on our earlier checklist, here’s a reasonable estimate for our 2-bedroom condo:
- Professional Cleaning: With an average of 19.5 bookings a month at $100 per clean, that comes out to $1,950/month, or a whopping $23,400 annually.
- Consumables & Supplies: I always budget 2% of gross revenue for this, which is $51,750 x 0.02 = $1,035 annually.
- Utilities (Wi-Fi, Electric, etc.): We'll peg this at a fixed $300 per month, totaling $3,600 for the year.
- Maintenance Fund: You have to plan for repairs. A smart 5% of gross revenue gives us a healthy fund of $51,750 x 0.05 = $2,587.50 annually.
Adding all that up, our total annual operating expenses are:
$7,762.50 (Commissions) + $23,400 (Cleaning) + $1,035 (Supplies) + $3,600 (Utilities) + $2,587.50 (Maintenance) = $38,385.
Building a solid profitability formula requires precision on both sides of the ledger. This process isn't so different from how you'd measure marketing ROI in any other business—every dollar needs to be accounted for.
Finding Your Net Operating Income
This is it, the final step: calculating your Net Operating Income (NOI). This is the single most important number for understanding your property's financial performance. It tells you exactly how much profit the property generates from its operations before you account for things like your mortgage or income taxes, which differ for every investor.
The formula couldn't be simpler:
NOI = Gross Revenue - Total Operating Expenses
For our 2-bedroom condo example:
NOI = $51,750 - $38,385 = $13,365
That $13,365 is the annual profit the property generates all on its own. It's the real number you can use to judge performance, compare it to other investment opportunities, and make sharp, strategic decisions. If you want to dive deeper into pricing strategies that can really boost this final number, check out our guide on what is dynamic pricing.
This methodical approach is more important than ever. Demand for short-term rentals is surging faster than supply in key markets, with the US seeing 7.0% year-over-year demand growth versus just 4.7% supply increase in early 2025. This imbalance is a dream for property managers using a precise short term rental income calculator to capitalize on tighter availability and higher rates. You can find more vacation rental statistics to see how these trends affect the market.
When you build your forecast this way—starting with seasonally adjusted revenue and meticulously subtracting every single expense—you move beyond guesswork. You create a reliable financial model that gives you the clarity and confidence to run a genuinely profitable short-term rental.
From Forecast to Fortune: Using AI and Direct Bookings to Grow Your Profits
Running the numbers with a short-term rental income calculator is a crucial first step. But the real magic happens when you start actively improving those numbers. Once you've got a solid forecast for your revenue and expenses, the next move is to find smart ways to widen that profit margin. This is where a little modern tech and savvy strategy can make a huge difference to your net income.
You don't just have to accept the market rates; you can influence them. You don't have to give away a huge slice of your revenue to commissions; you can take it back. The goal is to turn your income calculator from a passive spreadsheet into a dynamic game plan for growth.
Let AI Sweat the Small Stuff
The variables in your forecast—your ADR, occupancy, even cleaning fees—aren't set in stone. They're levers you can pull. This is where AI-driven tools, like the dynamic pricing features inside platforms like hostAI, come into play. They can optimize every single one of those levers for you in real-time.
Think of it like this: setting your prices manually is like picking a temperature on a thermostat and just hoping it works for the whole year. AI-powered dynamic pricing is the smart thermostat. It’s constantly adjusting based on the weather outside, how many people are in the house, and even the current price of energy. It crunches thousands of data points you could never track on your own.
- Market Demand: It knows when a big conference is announced or when flight bookings to your city suddenly spike, automatically bumping your rates to capture that surge.
- The Competition: The AI keeps a close eye on what your direct competitors are doing, adjusting your pricing to stay competitive without getting dragged into a race to the bottom.
- Booking Pace: Is your calendar filling up way faster than usual for a date three months from now? The system sees this and intelligently raises the price for the last few available nights.
This automated, data-backed approach means you're always charging the best possible price, pushing your ADR and gross revenue to their maximum potential.
The Game-Changing Power of Direct Bookings
Look at any host's profit and loss statement, and you'll see one of the biggest expenses staring back at you: OTA commissions. Forking over 15% or more of your revenue to a booking platform is a massive hit. The single most effective way to slash this cost is to generate your own direct bookings.
Shifting just 30% of your reservations from an OTA to your own direct booking website can add thousands of dollars straight to your net profit each year. You don't need a single extra guest to make it happen. This is the most powerful lever you can pull to boost your bottom line.
To pull this off, you need a professional online presence. That's where tools like hostAI come in, using smart SEO and website creation to build you a powerful direct booking engine from the ground up. They help you attract high-value guests who are already searching for places just like yours, letting them come straight to you and bypass the OTAs entirely. This strategy not only saves you a fortune in commissions but also puts you in complete control of the guest experience and your own brand.
A Tale of Two Properties
Let’s circle back to our 2-bedroom condo example. With a business model relying completely on OTAs, its Net Operating Income (NOI) was $13,365. Now, let's see what happens when the owner gets strategic with AI-powered pricing and a direct booking website.
Scenario A: The OTA-Reliant Property
- Gross Revenue: $51,750
- OTA Commissions (15%): $7,762
- Net Operating Income: $13,365
Scenario B: The hostAI-Powered Property
This owner makes two simple but powerful changes:
- AI Pricing: An AI pricing tool optimizes their rates, leading to a conservative 10% bump in gross revenue.
- Direct Bookings: Their new direct booking site successfully shifts 30% of bookings away from the OTAs.
Here’s how the new math shakes out:
- New Gross Revenue: $51,750 x 1.10 = $56,925
- OTA-Booked Revenue (70%): $56,925 x 0.70 = $39,847.50
- New OTA Commissions (15% of $39,847.50): $5,977
- Direct Booking Revenue (30%): $17,077.50 (with $0 in commissions!)
- Other Expenses: Kept the same for an apples-to-apples comparison.
- New Total Expenses (with lower commission): $36,599.50
- New Net Operating Income: $56,925 - $36,599.50 = $20,325.50
Just by implementing AI and driving direct bookings, the owner skyrocketed their net profit from $13,365 to $20,325.50. That's a 52% increase in take-home profit—a massive impact on the property's financial performance.
Answering the Tough Questions About Your Income Projections
Once you start plugging numbers into a calculator, the real-world questions pop up fast. How much can I actually trust this final number? What's the right way to handle the wild swings of seasonality? Getting a handle on these common sticking points is what turns a simple spreadsheet into a genuine business planning tool.
Let's dig into the questions I hear most often from property managers trying to get their financial forecasts right. I'll give you the straightforward, no-fluff answers you need to build a projection you can actually count on.
How Accurate Can a Short Term Rental Income Calculator Really Be?
Honestly, the accuracy of any forecast comes down to one thing: the quality of the data you put in. Garbage in, garbage out, as they say. If you're just grabbing generic, city-wide averages, you'll get a very rough estimate—more of a ballpark guess than a number you can take to the bank.
But when you start using property-specific data, things get much more precise. Inputting hyperlocal competitor rates, factoring in real seasonal demand shifts, and using your own historical numbers if you have them? That's when the accuracy skyrockets. The trick is to stop thinking of the calculator as a one-and-done setup. It’s a living document.
Your forecast is a dynamic tool. For maximum accuracy, commit to updating your key inputs—like ADR, occupancy, and known expenses—at least quarterly. This practice ensures your projections adapt as you gather more real-world performance data, making your future planning much more reliable.
How Should I Adjust My Calculations for Seasonality?
Whatever you do, don't use a single, flat annual average for your occupancy or nightly rate. That's the fastest way to get a forecast that's completely disconnected from reality. A much smarter approach is to break your year down into seasons based on demand.
For almost every market, that means setting up separate calculations for:
- Peak Season: Your busiest months with the highest demand and rates.
- Shoulder Seasons: Those transitional periods just before and after the rush, with moderate demand.
- Off-Season: The slowest time of year, when you'll need to be more competitive on price.
For each of these periods, you need to find specific ADR and occupancy data. Your formula should figure out the revenue for each season on its own, and then add them all up for a true annual total. Getting this granular is the only way to paint a realistic financial picture.
What Is the Biggest Mistake Managers Make When Calculating Income?
Easy. The most common and costly error I see is wildly underestimating expenses. It's so easy to get fixated on that big, exciting gross booking number and forget about all the little costs that chip away at your actual profit.
A solid forecast has to look beyond the top-line revenue. You have to be methodical and subtract every single operational cost. That includes things like:
- OTA commissions, which can easily take 15-20% of the booking value.
- Professional cleaning and laundry fees after every single stay.
- The cost of replacing linens, towels, and guest soaps.
- Software subscriptions for your PMS or pricing tools.
- A dedicated "slush fund" for unexpected maintenance and repairs.
Shifting your focus to Net Operating Income (NOI) instead of just gross revenue is the fundamental difference between running a profitable business and a very expensive hobby.
How Do Direct Bookings Impact My Income Calculation?
Driving more direct bookings is the single most powerful lever you can pull to boost your net income. It’s that simple. When you get a reservation through your own website, you completely sidestep that hefty 15-20% commission that goes to the OTAs.
In your income calculator, the impact is immediate and obvious. You're slashing a major expense line item, which makes your net profit margin jump. To put it in perspective, on a $2,000 booking, taking it direct adds an extra $300-$400 straight to your bottom line. You didn't need a single extra guest to make that happen.
Ready to turn your forecast into a growth engine? hostAI builds you a powerful direct booking website, helping you slash commission costs and take control of your profits. Start boosting your bottom line today.