
what is occupancy rate
What Is Occupancy Rate and How to Master It for Your STR
Posted on Feb 12, 2026
In the world of short-term rentals, one number tells you more about your business's health than almost any other: your occupancy rate.
Put simply, it’s the percentage of nights your property was booked compared to all the nights it was available. It’s the clearest, most direct way to see just how full your calendar really is.
A Simple Guide to Understanding Occupancy Rate
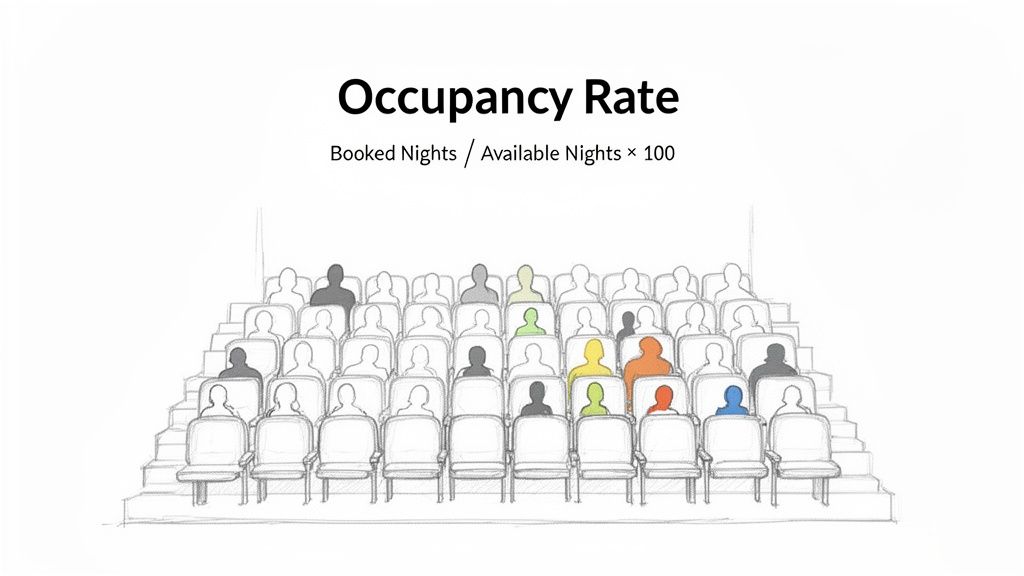
Think of your vacation rental as a small theater. If you have 30 nights available in a month, that’s like having 30 seats to sell. If guests book 24 of those nights, you’ve sold 24 tickets. Your theater is 80% full—and that 80% is your occupancy rate. It's a direct reflection of how much demand there is for your property.
This single metric gives you a powerful snapshot of your performance. A high occupancy rate is a great sign; it usually means your pricing, marketing, and property appeal are all working together. On the flip side, a low rate is an immediate red flag that something isn't quite right and needs a closer look.
The Basic Formula Explained
Figuring out your occupancy rate is refreshingly simple. It’s a basic calculation that reveals how much of your available calendar was actually used by paying guests.
Occupancy Rate = (Total Nights Booked / Total Nights Available) x 100
To get this right, you just need to nail down two key pieces of information. "Total Nights Booked" is exactly what it sounds like: the number of nights guests actually stayed at your property over a set period.
"Total Nights Available" is the total number of nights your property was open for bookings during that same time. Critically, this excludes any nights you blocked off for personal use, maintenance, or repairs. You weren't trying to rent it out on those days, so they don't count against you.
Once you get a handle on these two components, you’re on your way to making smarter, data-backed decisions for your rental. You can dive deeper into the various factors that influence vacation rental occupancy rates in our complete guide.
Decoding the Occupancy Rate Formula
Here’s a quick reference to help you get comfortable with the key parts of your occupancy calculation.
| Component | What It Means | Why It Matters for Your STR |
|---|---|---|
| Total Nights Booked | The count of paid nights your property was occupied by guests. | This is your ultimate measure of demand. More booked nights directly translate to more top-line revenue. |
| Total Nights Available | The total number of nights your property was listed as available for rent. | This sets an accurate baseline for performance. By excluding blocked dates, you get a true picture of your rental’s appeal when it was actually on the market. |
| The Result (%) | The final percentage representing your property's occupancy. | This is your key performance indicator (KPI). It allows you to benchmark your success against past performance and see how you stack up against the local market. |
Knowing this formula inside and out is the first step toward optimizing your STR strategy and maximizing your rental income.
How to Accurately Calculate Your Occupancy Rate
Alright, let's get down to brass tacks. Understanding the formula for occupancy rate is one thing, but actually putting it to work correctly—that's what makes the difference. Let's move from theory to practice with a simple, step-by-step guide to make sure you’re getting a real, honest look at your rental's performance.
We’ll kick things off with a straightforward example to get our footing.
Calculating for a Single Property Monthly
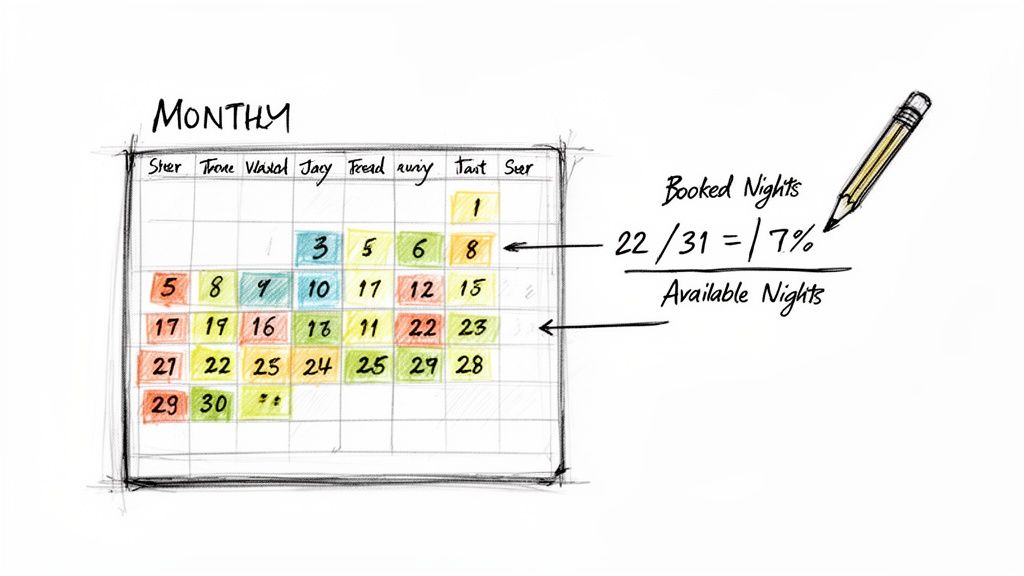
Picture this: you own a cozy cabin in the mountains and want to check its performance for July. July has 31 days, so that’s our starting point for the total number of nights available in the month.
This past July, your cabin was booked by guests for a grand total of 22 nights. Now, we just pop those numbers into the formula we talked about earlier:
- Total Nights Booked: 22
- Total Nights Available: 31
- Calculation: (22 / 31) x 100
Just like that, you know your cabin's occupancy rate for July was 71%. This quick calculation gives you a solid performance snapshot for the month. Simple, right?
The Nuance of Blocked Nights
Now, let's toss a wrench in the works—a scenario that trips up a lot of hosts: blocked nights. What happens if you used the cabin yourself for a long weekend? Or had to block a few nights for some much-needed maintenance?
This is where you need to get picky about the difference between "total nights in a period" and "total available nights." It’s a crucial distinction. Any night your property isn't actually available for a booking—whether for personal use, repairs, or renovations—should not be counted against your occupancy rate.
Let’s go back to our cabin example. In July, you blocked off four nights for a family visit. This means your cabin was only truly available for guests to book for 27 nights (31 total nights - 4 blocked nights).
Here’s how the more accurate calculation looks:
- Determine Total Booked Nights: You still had 22 nights booked by paying guests.
- Determine True Available Nights: Subtract your blocked dates from the total days in the month (31 - 4 = 27 Available Nights).
- Calculate the Accurate Occupancy Rate: (22 / 27) x 100 = 81.5%.
By properly accounting for those blocked dates, your occupancy rate jumped from 71% to over 81%. This number tells a much truer story—it reflects how your property performed when it was actually on the market, competing for bookings.
If you don't exclude these unavailable nights, you're just artificially deflating your numbers. It’ll make it look like your property is underperforming when, in reality, it's doing great.
Scaling Up to an Annual or Portfolio View
Calculating your occupancy rate gets even more powerful when you zoom out to look at longer periods or multiple properties. This is how you spot the bigger trends and really get a feel for the overall health of your short-term rental business.
To figure out the annual occupancy rate for a single property, you just apply the same logic on a bigger scale.
- Step 1: Add up all the nights your property was booked for the entire year.
- Step 2: Add up all the nights it was available for booking (Total days in the year - Total blocked nights).
- Step 3: Divide the total booked nights by the total available nights and multiply by 100.
Got a whole portfolio of properties? The process is pretty much the same. You’ll just need to add up the booked nights and available nights across all your listings for whatever period you're looking at. This gives you a combined occupancy rate, offering that high-level view of how your entire operation is performing. Nailing this calculation is the key to unlocking deeper insights and making smarter, more strategic decisions.
Why Occupancy Is Only One Piece of the Puzzle
A full calendar is a beautiful sight. But chasing a 100% occupancy rate without a smart strategy can be a costly mistake.
While it’s a crucial measure of demand, occupancy alone doesn't paint the whole picture of your short-term rental's financial health. It's just one piece of a much larger, more important puzzle.
Focusing solely on filling rooms often leads hosts to a dangerous temptation: aggressively slashing prices. Sure, a lower price might attract a last-minute booking, but at what cost? This approach can quickly erode your profit margins and devalue your property in the eyes of future guests. Profitability isn't just about being booked; it's about being booked at the right price.
The Three-Legged Stool of STR Success
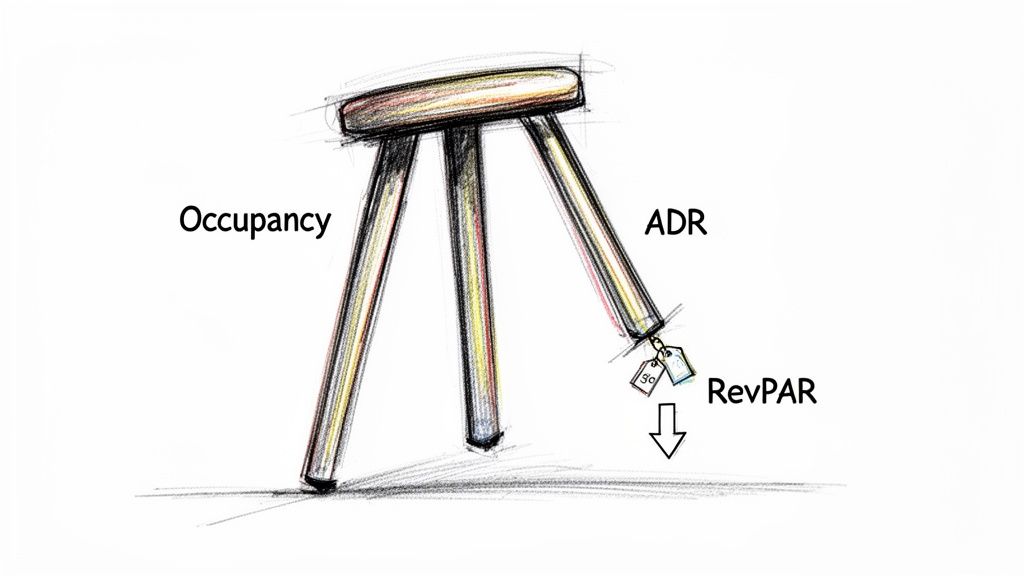
Think of your rental business as a three-legged stool, where each leg represents a key performance metric. For the stool to be stable and support your business, all three legs must be strong and balanced.
- Leg 1 Occupancy Rate: This is the measure of how full your property is.
- Leg 2 Average Daily Rate (ADR): This is the average price you charge per booked night.
- Leg 3 Revenue Per Available Room (RevPAR): This is the ultimate measure of your revenue-generating power.
If you sacrifice one leg for another—like cutting your ADR (price) just to boost your occupancy—the whole stool becomes unstable. For example, a property with 95% occupancy but an ADR of only $100 is far less profitable than one with 75% occupancy at an ADR of $250. The second property generates significantly more revenue with less wear and tear.
The goal isn't just to be busy; it's to be profitable. RevPAR, calculated by multiplying your ADR by your occupancy rate, is the true indicator of success because it shows how well you balance price and bookings to maximize income from every available night.
Finding Your Market Sweet Spot
So, what is a good occupancy rate? The honest answer is: it depends entirely on your market.
A 65% occupancy rate might be exceptional for a seasonal beach house in the off-season, while the same figure could be a sign of trouble for a downtown apartment in a bustling city. The key is to stop chasing a universal magic number and start benchmarking against your direct competitors.
Understanding your local market's performance transforms your occupancy data from a simple number into a powerful strategic tool. It provides the context you need to know if you're leading the pack or falling behind.
Recent industry data highlights just how much these benchmarks can vary. In 2023, the U.S. hotel industry's annual occupancy rate saw its first dip since 2020, falling to 62.3%. However, performance was wildly different from city to city; Houston saw a significant 8.6% drop to 58.9%, while New York City maintained an incredibly strong 84.1% occupancy. You can explore more about these market fluctuations in Hotel Dive's 2024 outlook.
The Trade-Off Between Occupancy and Revenue
To see how focusing solely on occupancy can impact your bottom line, let's look at a couple of scenarios for a property available for 30 nights. This really drives home the critical balance between filling rooms and pricing them right.
| Scenario | Occupancy Rate Change | ADR Change | Impact on RevPAR | Strategic Takeaway |
|---|---|---|---|---|
| High Occupancy, Low Rate | 90% (27 nights) | $150 | $4,050 | Chasing a full calendar by discounting rates leaves significant money on the table and increases operational costs. |
| Balanced Strategy | 70% (21 nights) | $250 | $5,250 | Prioritizing a healthy nightly rate over maximum occupancy leads to higher revenue with fewer turnovers. |
As you can see, the balanced approach generated $1,200 more in revenue with six fewer bookings. This means less cleaning, fewer guest communications, and reduced wear and tear on your property.
The lesson is clear: a slightly lower occupancy rate can be far more profitable when paired with a strong pricing strategy. This is the essence of smart revenue management.
Proven Strategies to Increase Your Occupancy and Revenue
Understanding your occupancy rate is one thing; doing something about it is where the real growth happens. Boosting your bookings isn't about guesswork. It’s about a smart, multi-layered strategy that attracts more guests without gutting your nightly rate.
The good news? You have more control than you might think. By zeroing in on a few key areas—pricing, distribution, marketing, and the guest experience—you can turn those empty nights into profitable stays. This isn't about working harder; it's about working smarter with the right tactics.
The global travel market is bouncing back in a big way, and that's a huge opportunity for proactive hosts. Hotel occupancy in Europe has hit a healthy 73%, and overall rates have climbed to 72%, even beating pre-pandemic numbers in some cases. Paired with a 15% jump in RevPAR to $112.50, it's clear the tourism rebound is on. You can discover more about these regional travel trends on Statista.com.
Master Your Pricing and Availability
Your pricing strategy is the most powerful lever you have for nudging your occupancy rate up or down. A "set it and forget it" approach is a surefire way to leave money on the table. Instead, your pricing should be alive, reacting to what the market is telling you in real-time.
- Implement Dynamic Pricing: This is non-negotiable. Adjust your rates based on demand. That means charging a premium for holidays, local festivals, or big concerts, and offering more competitive rates during the slow season to catch the eye of budget-conscious travelers.
- Adjust Minimum Stay Requirements: In peak season, a longer minimum stay can lock in more revenue and cut down on turnover costs. But in the off-season? Allowing one or two-night stays during the week can fill calendar gaps that would otherwise sit empty.
- Offer Strategic Discounts: Instead of just slashing prices, get creative. Think promotions like "book three nights, get the fourth 50% off" for mid-week stays or an early-bird special for guests who book months ahead.
This kind of hands-on approach keeps you priced competitively, squeezing the maximum revenue out of every single available night. For a deeper dive, you can learn more about what is dynamic pricing in our comprehensive guide.
Expand Your Reach with Smart Distribution
You could have the most stunning property with perfect pricing, but if nobody can find it, your calendar will remain painfully empty. Visibility is everything. You need to be where your potential guests are looking.
Don't put all your eggs in one basket. Relying only on Airbnb or Vrbo limits your audience and leaves you vulnerable to their algorithm changes and commission hikes.
A multi-channel distribution strategy is your best bet for maximizing occupancy. This means listing your property on several Online Travel Agencies (OTAs) while also nurturing your own direct booking website. This combo gives you the massive reach of the big platforms and the high-profit, direct relationship with your guests.
Tools like hostAI's hostDistro can put this on autopilot, running targeted ad campaigns across different channels to bring the right guests to you. Combine that with a high-converting direct booking site from hostFront, and you’ve built a powerful engine for driving bookings from every corner of the web.
Elevate the Guest Experience to Drive Repeat Bookings
The guest experience doesn’t start when they walk through the door; it begins the second they book and continues long after they’ve checked out. A flawless, memorable experience is your best marketing tool. It leads to glowing reviews and repeat customers—two of the biggest drivers of a high occupancy rate.
To create stays that people talk about, focus on these areas:
- Crystal-Clear Communication: Automate your essential messages. Use a tool like hostMail to send timely check-in instructions, a quick mid-stay check-in, and a thank-you note after they leave. Guests feel cared for, and you don't have to lift a finger.
- Impeccable Cleanliness: This is the absolute baseline. A spotless property is the foundation of every five-star review. Using a detailed short term rental cleaning checklist can make a world of difference in guest satisfaction, which translates directly to better reviews and higher occupancy.
- Thoughtful Touches: Go beyond the basics. A small welcome basket with local snacks, a guidebook with your personal favorite spots, or even just high-quality coffee can turn a good stay into a great one. These small investments pay off massively in guest loyalty.
By applying these strategies consistently, you can build a system that doesn't just fill your calendar. It builds your brand, boosts your bottom line, and creates a more resilient and profitable short-term rental business.
Common Occupancy Management Mistakes to Avoid
Even the most seasoned short-term rental managers fall into common traps that quietly chip away at their profits. Knowing your occupancy rate is just the first step; how you act on that number is what really separates the pros from the amateurs. Sidestepping these frequent blunders is your key to building a rental business that’s not just busy, but genuinely profitable.
Think of this as your strategy’s troubleshooting guide. We’re going to pinpoint the costly errors many hosts make and give you clear, actionable ways to get back on track.
Mistake 1: The 100% Occupancy Obsession
The siren call of a fully booked calendar is strong, but it’s one of the most dangerous temptations in this business. Chasing 100% occupancy at any cost usually means slashing your prices so low that your profit margins completely vanish. It’s the classic mistake of winning the battle but losing the war.
Remember, every single booking has real costs attached—cleaning, utilities, supplies, and general wear and tear. A night booked at a rock-bottom rate might look better than an empty night, but after you subtract all those expenses, you could actually be losing money. The goal isn't just to be booked; it's to be profitable.
The Fix: Shift your focus from pure occupancy to RevPAR (Revenue Per Available Room). A property with 75% occupancy at an average of $250/night is way more profitable than one at 95% occupancy earning just $150/night. This balanced view makes sure you're squeezing the most income out of every available night, not just filling beds.
Mistake 2: Ignoring Your Local Market Data
Setting your prices in a vacuum is like trying to navigate a new city without a map. If you aren't constantly checking your performance against the local competition, you have no real way of knowing if your occupancy rate is fantastic, average, or downright terrible. A 60% occupancy rate might be amazing for your market’s shoulder season but a huge red flag during a peak holiday weekend.
Without market context, you’re just guessing. You could be leaving money on the table during high-demand events or pricing yourself out of the market during slow periods—both of which kill your bottom line.
Actionable Solution:
- Use Data Tools: Make a habit of checking market data from sources like AirDNA to see what average occupancy, nightly rates, and booking lead times look like for properties similar to yours.
- Track Local Events: Keep a calendar of every concert, festival, conference, and holiday in your area. These are goldmines for adjusting your pricing and minimum stay rules to capture surges in demand.
- Analyze Your Comps: Pick your top five direct competitors and keep an eye on their pricing and availability calendars. This isn’t about starting a race to the bottom on price; it’s about staying competitive and understanding the local landscape.
Mistake 3: Letting the Guest Experience Slip
When you’re laser-focused on maximizing bookings, it’s all too easy to let the little things slide. You might start cutting corners on cleaning, taking longer to reply to messages, or ignoring those tired-looking linens. This is a short-sighted strategy that will always, always come back to bite you.
A subpar experience leads directly to mediocre or negative reviews. And in the world of online bookings, social proof is everything. As your star rating drops, your property becomes less attractive to potential guests, forcing you to lower your prices just to get noticed. Suddenly, you're right back at Mistake #1.
On the flip side, a fantastic guest experience creates a powerful cycle: glowing reviews lead to higher demand, which lets you command premium rates and achieve healthy occupancy.
Analyzing and Reporting Your Occupancy Data
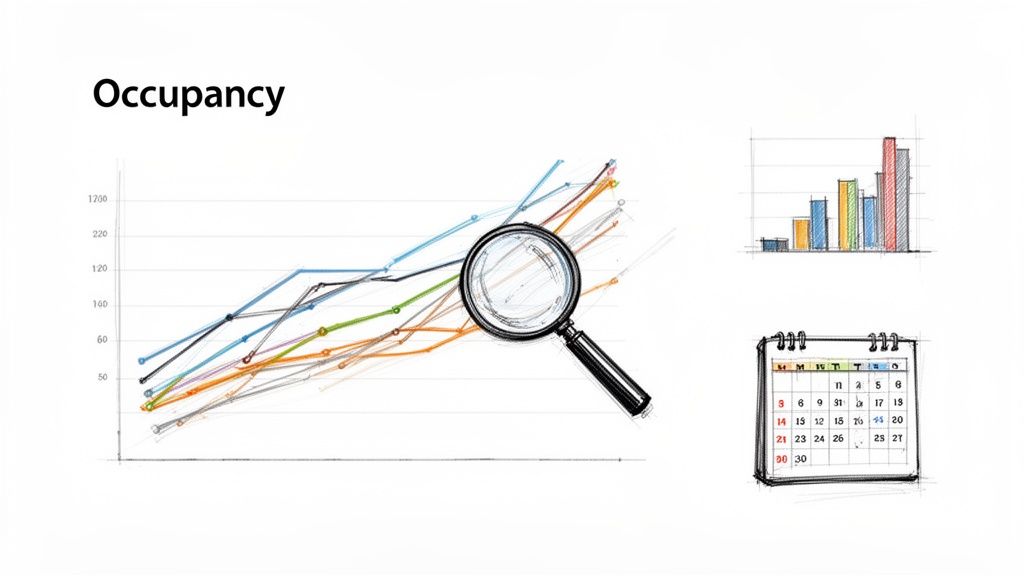
Collecting booking data is one thing. Actually turning those raw numbers into a clear, actionable strategy that grows your business is another game entirely. The most successful hosts don't just know their occupancy rate; they understand the story their data is telling them over time.
To get there, you need a rhythm. Establishing a consistent reporting cadence is the first step, helping you monitor performance without getting lost in a sea of spreadsheets.
Your Reporting Cadence
A simple, structured approach ensures you’re looking at the right data at the right time, so you can stop reacting and start planning.
- Weekly Check-ins: Take a quick glance at your calendar for the next 30-60 days. This is all about spotting gaps and making quick, last-minute pricing adjustments to fill them.
- Monthly Reviews: This is where you look back at the past month's performance. How did your occupancy rate, ADR, and RevPAR stack up against the previous month? More importantly, how does it compare to the same month last year?
- Quarterly Strategy Sessions: Time to zoom out and see the big picture. Are your seasonal strategies working? Is your portfolio growing? How are you performing against the broader market? For context, you can check out these Airbnb stats by city.
It’s also incredibly insightful to understand the flip side of occupancy. When you uncover vacancy rates and investment opportunities in your market, you get a much fuller picture of its overall health.
Comparing your performance year-over-year is crucial because it filters out the noise of normal seasonality. A dip in October might seem alarming on its own, but if occupancy was even lower last October, you’re actually seeing real year-over-year growth.
From Spreadsheets to Strategy
Let's be honest—manually pulling data from different platforms is a tedious chore and a recipe for errors. This is where having a centralized dashboard becomes a non-negotiable for serious hosts. Instead of wrestling with spreadsheets, you get all your key metrics in one clean view.
This is exactly the problem platforms like hostAI were built to solve. They automatically pull and organize data from all your channels into simple, real-time reports. In an instant, you can see occupancy trends, revenue metrics, and booking pace without lifting a finger.
This simple shift frees you up to focus on what actually moves the needle: making smart, proactive decisions based on what the data is telling you. You can spot opportunities, fix issues before they become real problems, and spend your valuable time on strategy, not data entry.
Got Questions About Occupancy Rate? We've Got Answers.
Even after you've got the basics down, a few questions about occupancy rate always seem to pop up. We see them all the time. Let's clear up some of the most common ones so you can apply these concepts with confidence to your own rental business.
What Is a Good Occupancy Rate for a Vacation Rental?
This is the million-dollar question, and the honest answer is: it depends. There’s no universal magic number that works for everyone. A "good" rate for a ski chalet in Aspen is going to look completely different from a beachfront condo in Florida.
A mountain cabin might crush it with 90% occupancy in the winter but be thrilled to hit 40% during the summer mud season. The real game isn't about chasing some arbitrary percentage. It's about consistently beating your direct competitors in your specific local market. Use market data tools to get a realistic benchmark for your area and aim to outperform it.
Success isn't just about being full; it's about being profitable. The sweet spot is finding the perfect balance between your occupancy and your nightly rate (ADR) to maximize your total revenue—a metric best captured by RevPAR.
Should I Lower My Price to Get More Bookings?
It's tempting, isn't it? An empty night on the calendar can feel like a failure, and slashing the price seems like a quick fix. But resist that knee-jerk reaction. While a steep discount might snag a last-minute booking, it can devalue your property in the long run and seriously eat into your profits.
Before you cut a rate in half, do the math. Are two nights at a lower price really more profitable than one night at your standard rate, especially after you factor in cleaning and operational costs? Often, the answer is no. Instead of defaulting to discounts, try offering a value-add like a late checkout or running a targeted promotion first. Smart revenue management is a balancing act between occupancy and ADR, not just a race to fill every single day.
How Do Blocked Nights Affect My Occupancy Rate?
This is a critical detail that can throw off your entire analysis if you get it wrong. Any nights you block off for personal use, deep cleaning, or essential repairs need to be completely removed from your "Total Available Nights" when you calculate your occupancy.
Think of it this way: if you block four nights for a family visit in a 30-day month, your denominator becomes 26, not 30. Making this adjustment gives you a true performance metric for the time your property was actually open for business. If you leave those blocked dates in, you’ll artificially deflate your occupancy rate and get a misleading picture of how well your rental is actually performing in the market.
Ready to stop guessing and start making data-driven decisions? hostAI provides the tools you need to analyze performance, optimize pricing, and increase your direct bookings automatically. See how we can help you turn insights into income at https://gethostai.com.